
Hello TEAM,
I have two Question for you, I would like to have your support on it.
- Is there any way you can export the report in Excel sheet?
- Is there way you can present the report in pie chart without doing it manually

Hello TEAM,
I have two Question for you, I would like to have your support on it.

") +5
+5
Greetings from Freshworks community.
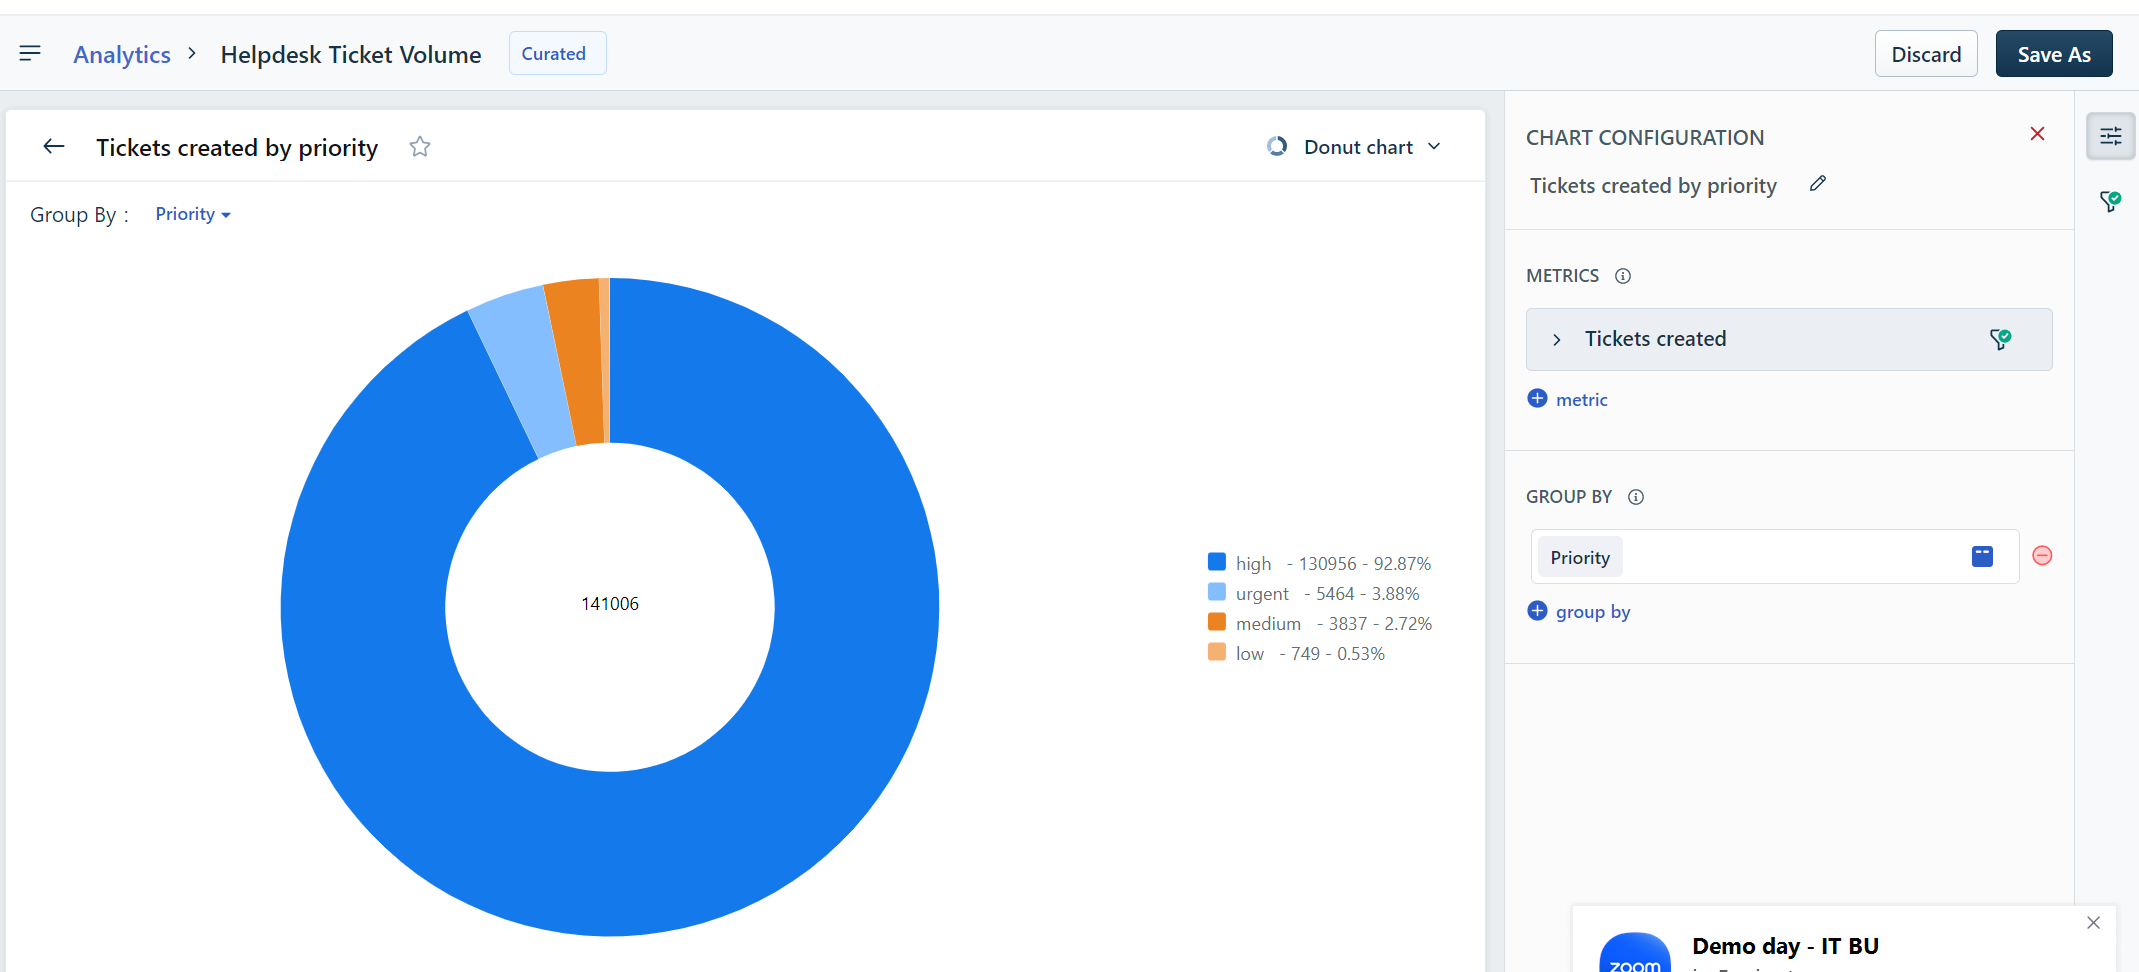
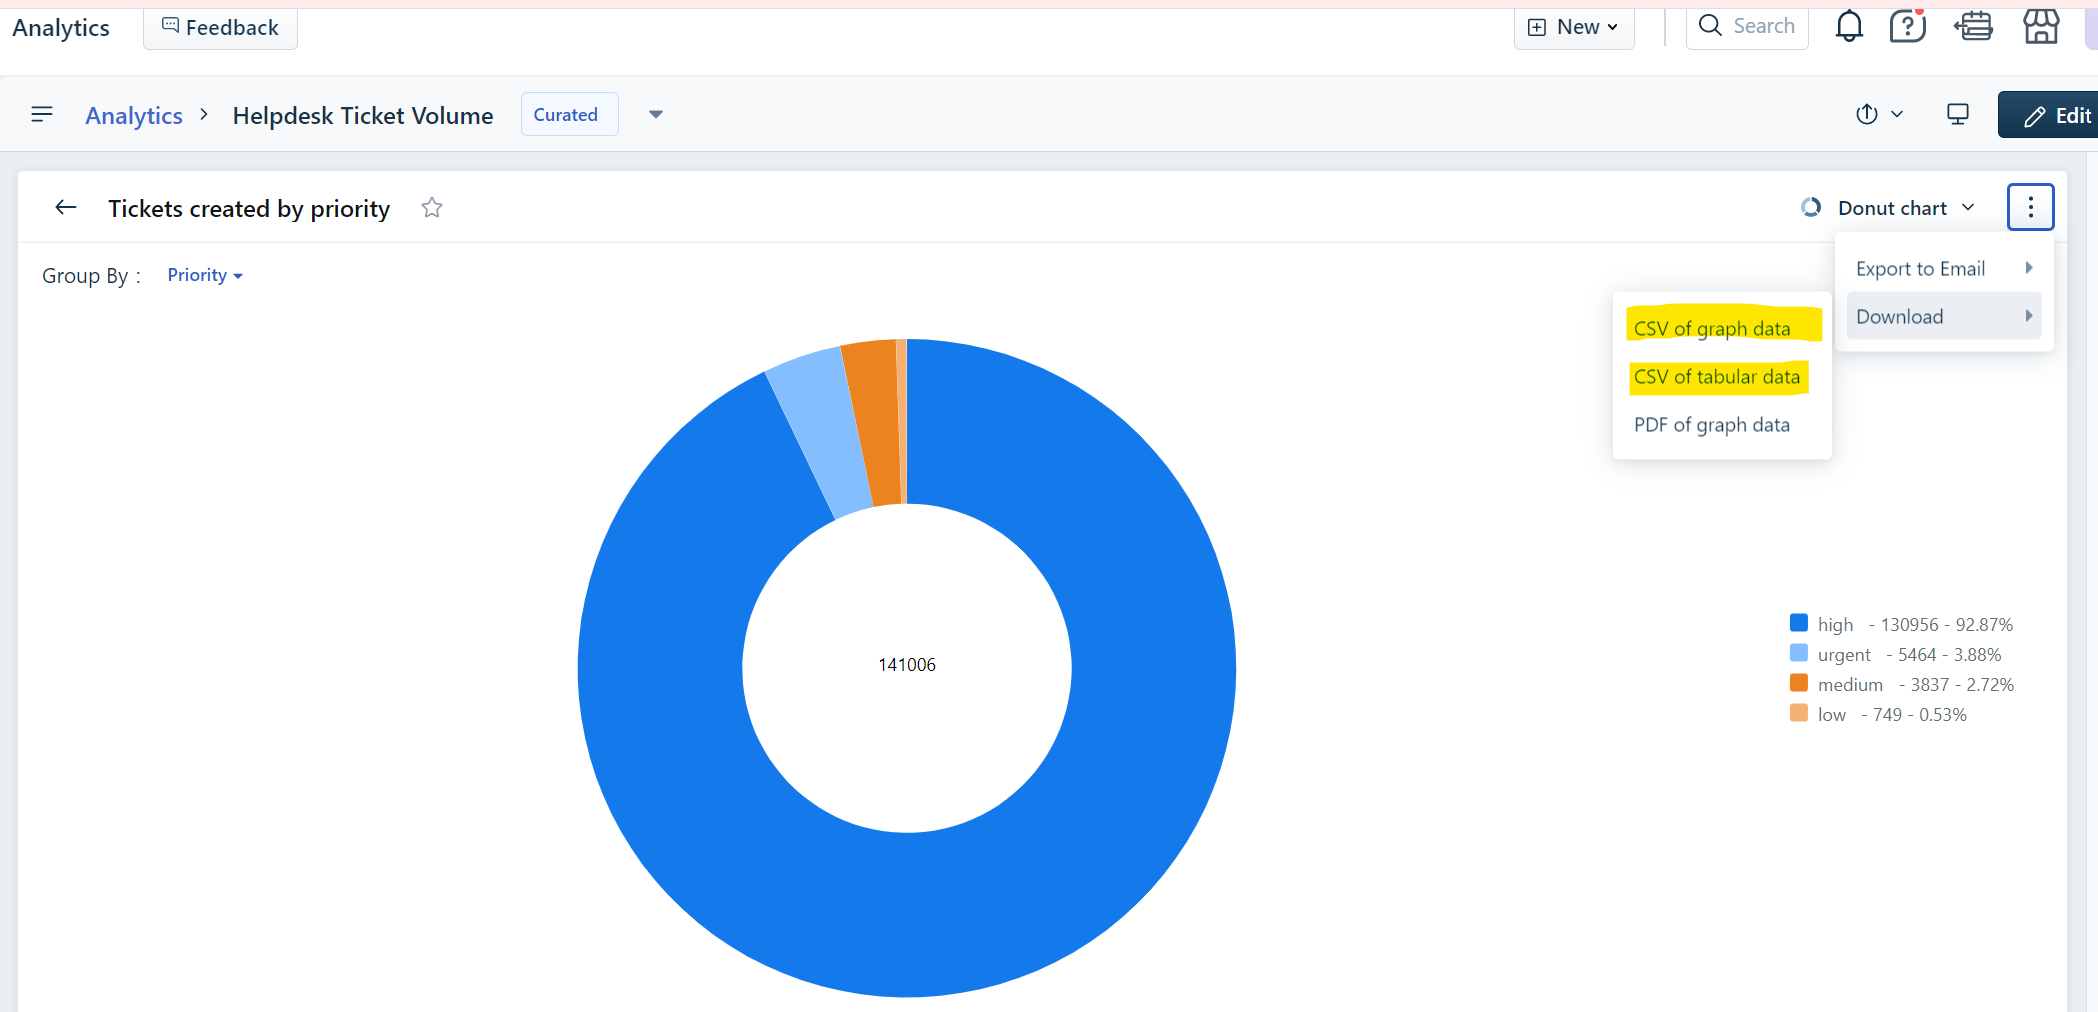
Analytics module gives you lot of flexibility to create multiple format of reports with different metrics and can be designed to show as Pie chart automatically with the resulting metrics. Grouped bar, Stacked Bar, Horizontal Grouped Bar, Horizontal Stacked Bar, Pie, Donut, Line, Area, Scatter Plot are the visualization available default when you create a report and also gives you option to download the entire report as CSV or individual widget as CSV.
To know more about the report creation, download and visualization,
SNIP as below FYR
Enter your username or e-mail address. We'll send you an e-mail with instructions to reset your password.