Closed for Voting

Classic Helpdesk at a Glance Graphs in Helpdesk at a Glance

Related products:Freshdesk
  • November 18, 2013
  • 4 replies
  • 25 views

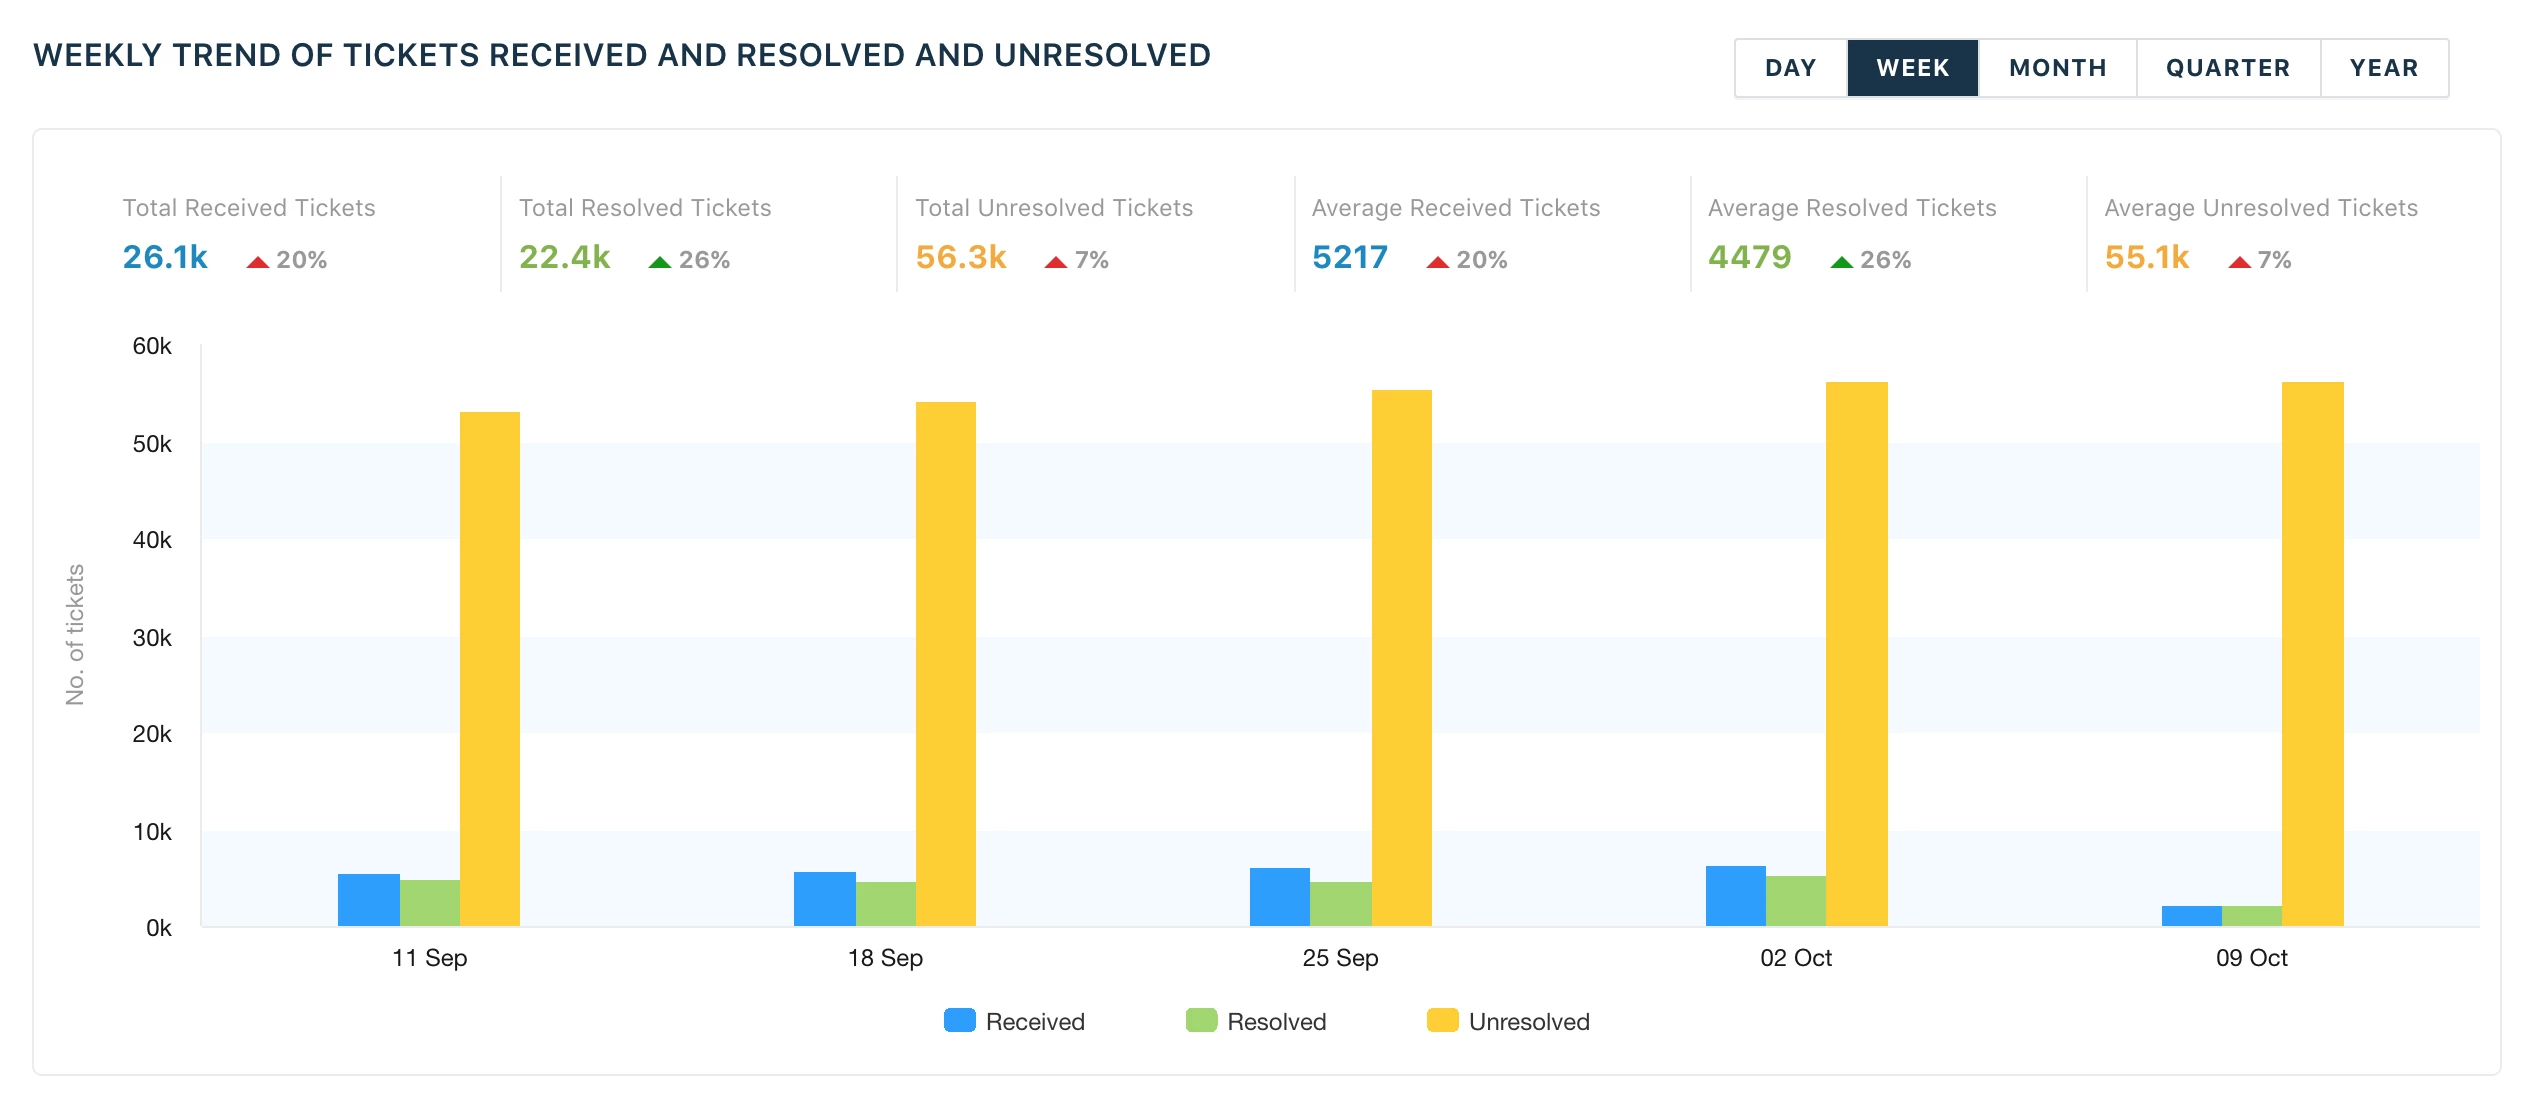
The daily Submitted versus Resolved graphs in the Helpdesk at a Glance classic report are probably the most useful metrics I get from Freshdesk.  I would love to see that graph in the newer Helpdesk at a Glance report.

4 replies

Absolutely, please add!


aravind.sundararajan
Skilled Expert
Forum|alt.badge.img+12

Hello,


The resolved/received trend graph can be obtained from the Ticket Volume trends report in the new reporting suite. In addition to this, it also provides Load analysis and Busy hour/day for the helpdesk metrics that can help in understanding the load for the agents and also help you in planning the staffing for busy days.


Cheers!


  • Community Debut
  • June 8, 2020

How can i use it? Please can you help me? on my side its not showing graph option to see all remaining tickets and resolved tickets?


suprabha.somanathan
Community Debut

@Mubeen -


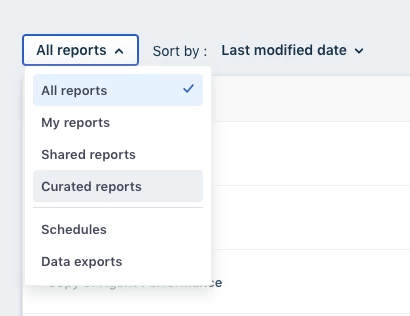
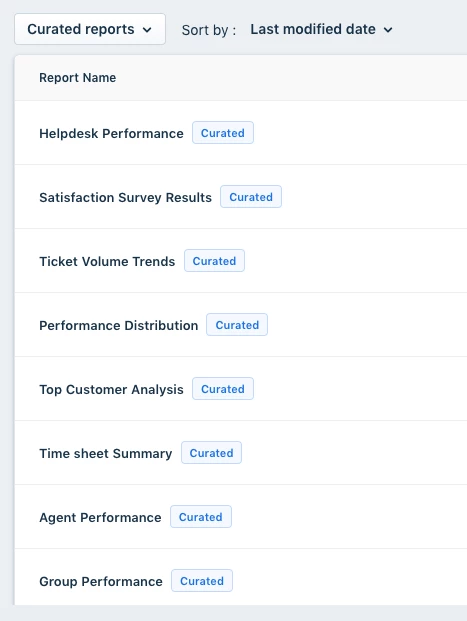
You could navigate to Analytics > Curated reports >Ticket volume trends.


You could apply report level filters further to customize the same.

If you are looking for more advanced filters to work with, write to us at customersuccess@freshworks.com and one of our experts will be in touch.


Thanks!