



The Analytics UI does not display values on bar charts, line graphs etc. These are only visible on mouseover.
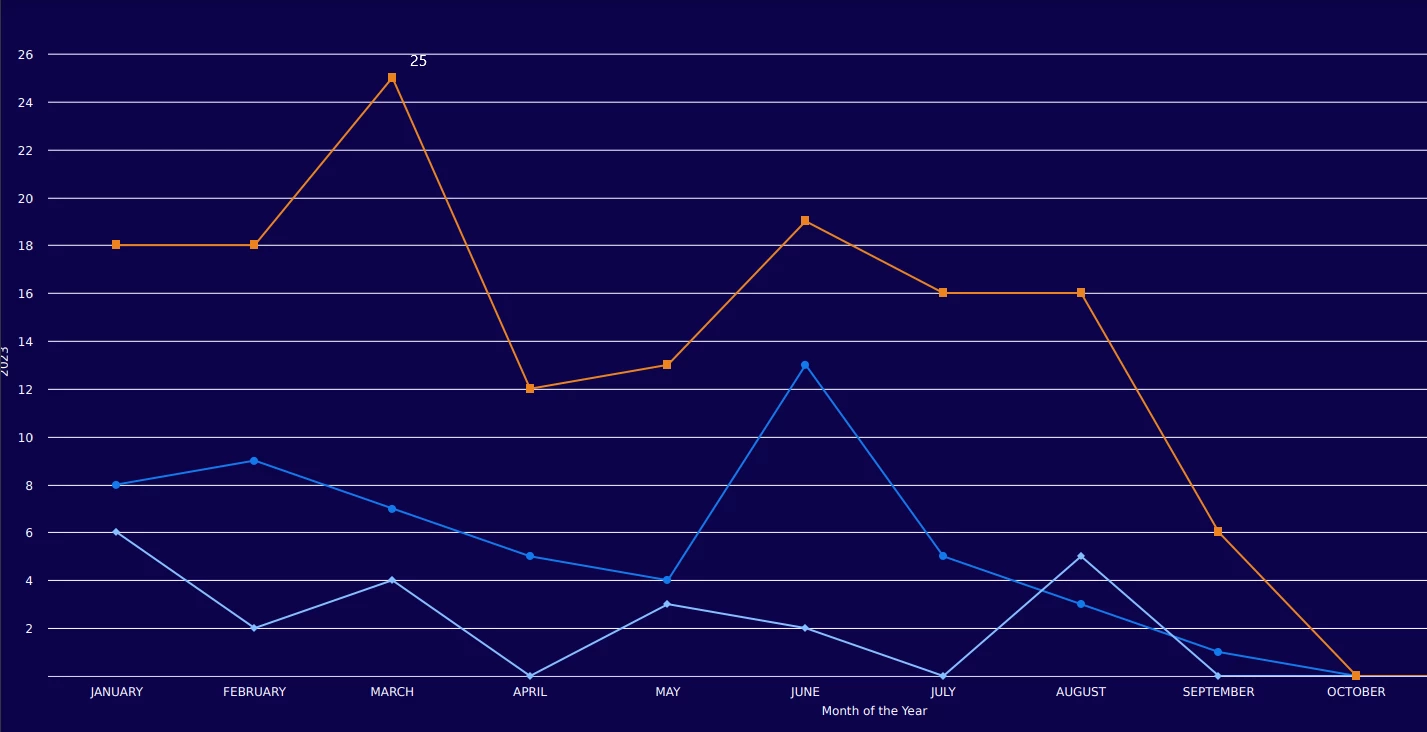
This is bad UX. Graphs often need to be exported and therefore the mouseover value display is absent. I want to be able to show the specific value - like the below - rather than having to look at the axis and figure out what that value is.
:
