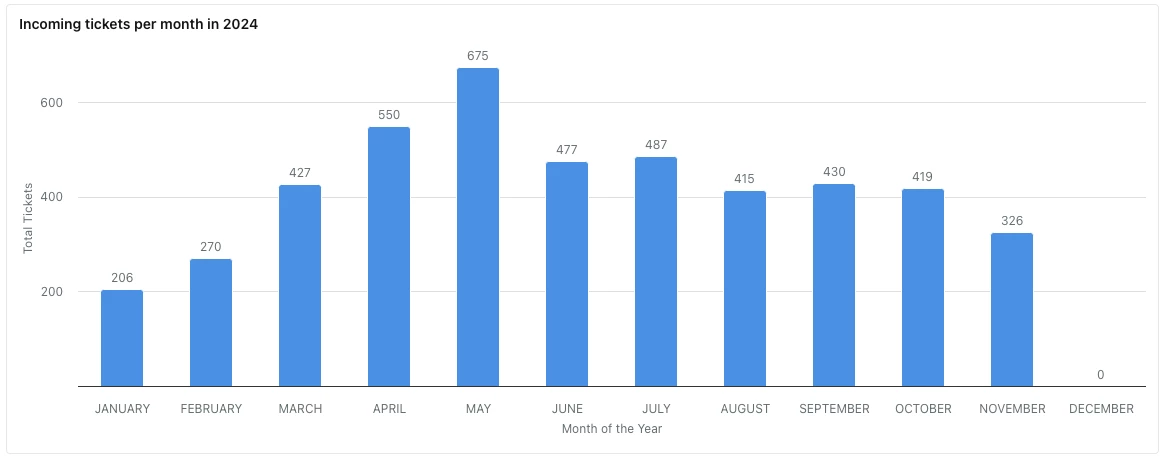
Hello, in Analytics module, you can use many graphics but the number are hidden unles you hover the mouse cursor over the graphics. We think could be more usefull to show total count on the bar graph report in Analytics.
Thanks in advance.




Hello, in Analytics module, you can use many graphics but the number are hidden unles you hover the mouse cursor over the graphics. We think could be more usefull to show total count on the bar graph report in Analytics.
Thanks in advance.
Already have an account? Login
No account yet? Create an account
Enter your E-mail address. We'll send you an e-mail with instructions to reset your password.