

Delivered

Show values on reports

Related products:Freshdesk
  • Jan 23, 2023 11:23 AM UTC
  • 2 replies
  • 37 views

e.c.kane
Skilled Expert
Forum|alt.badge.img+3

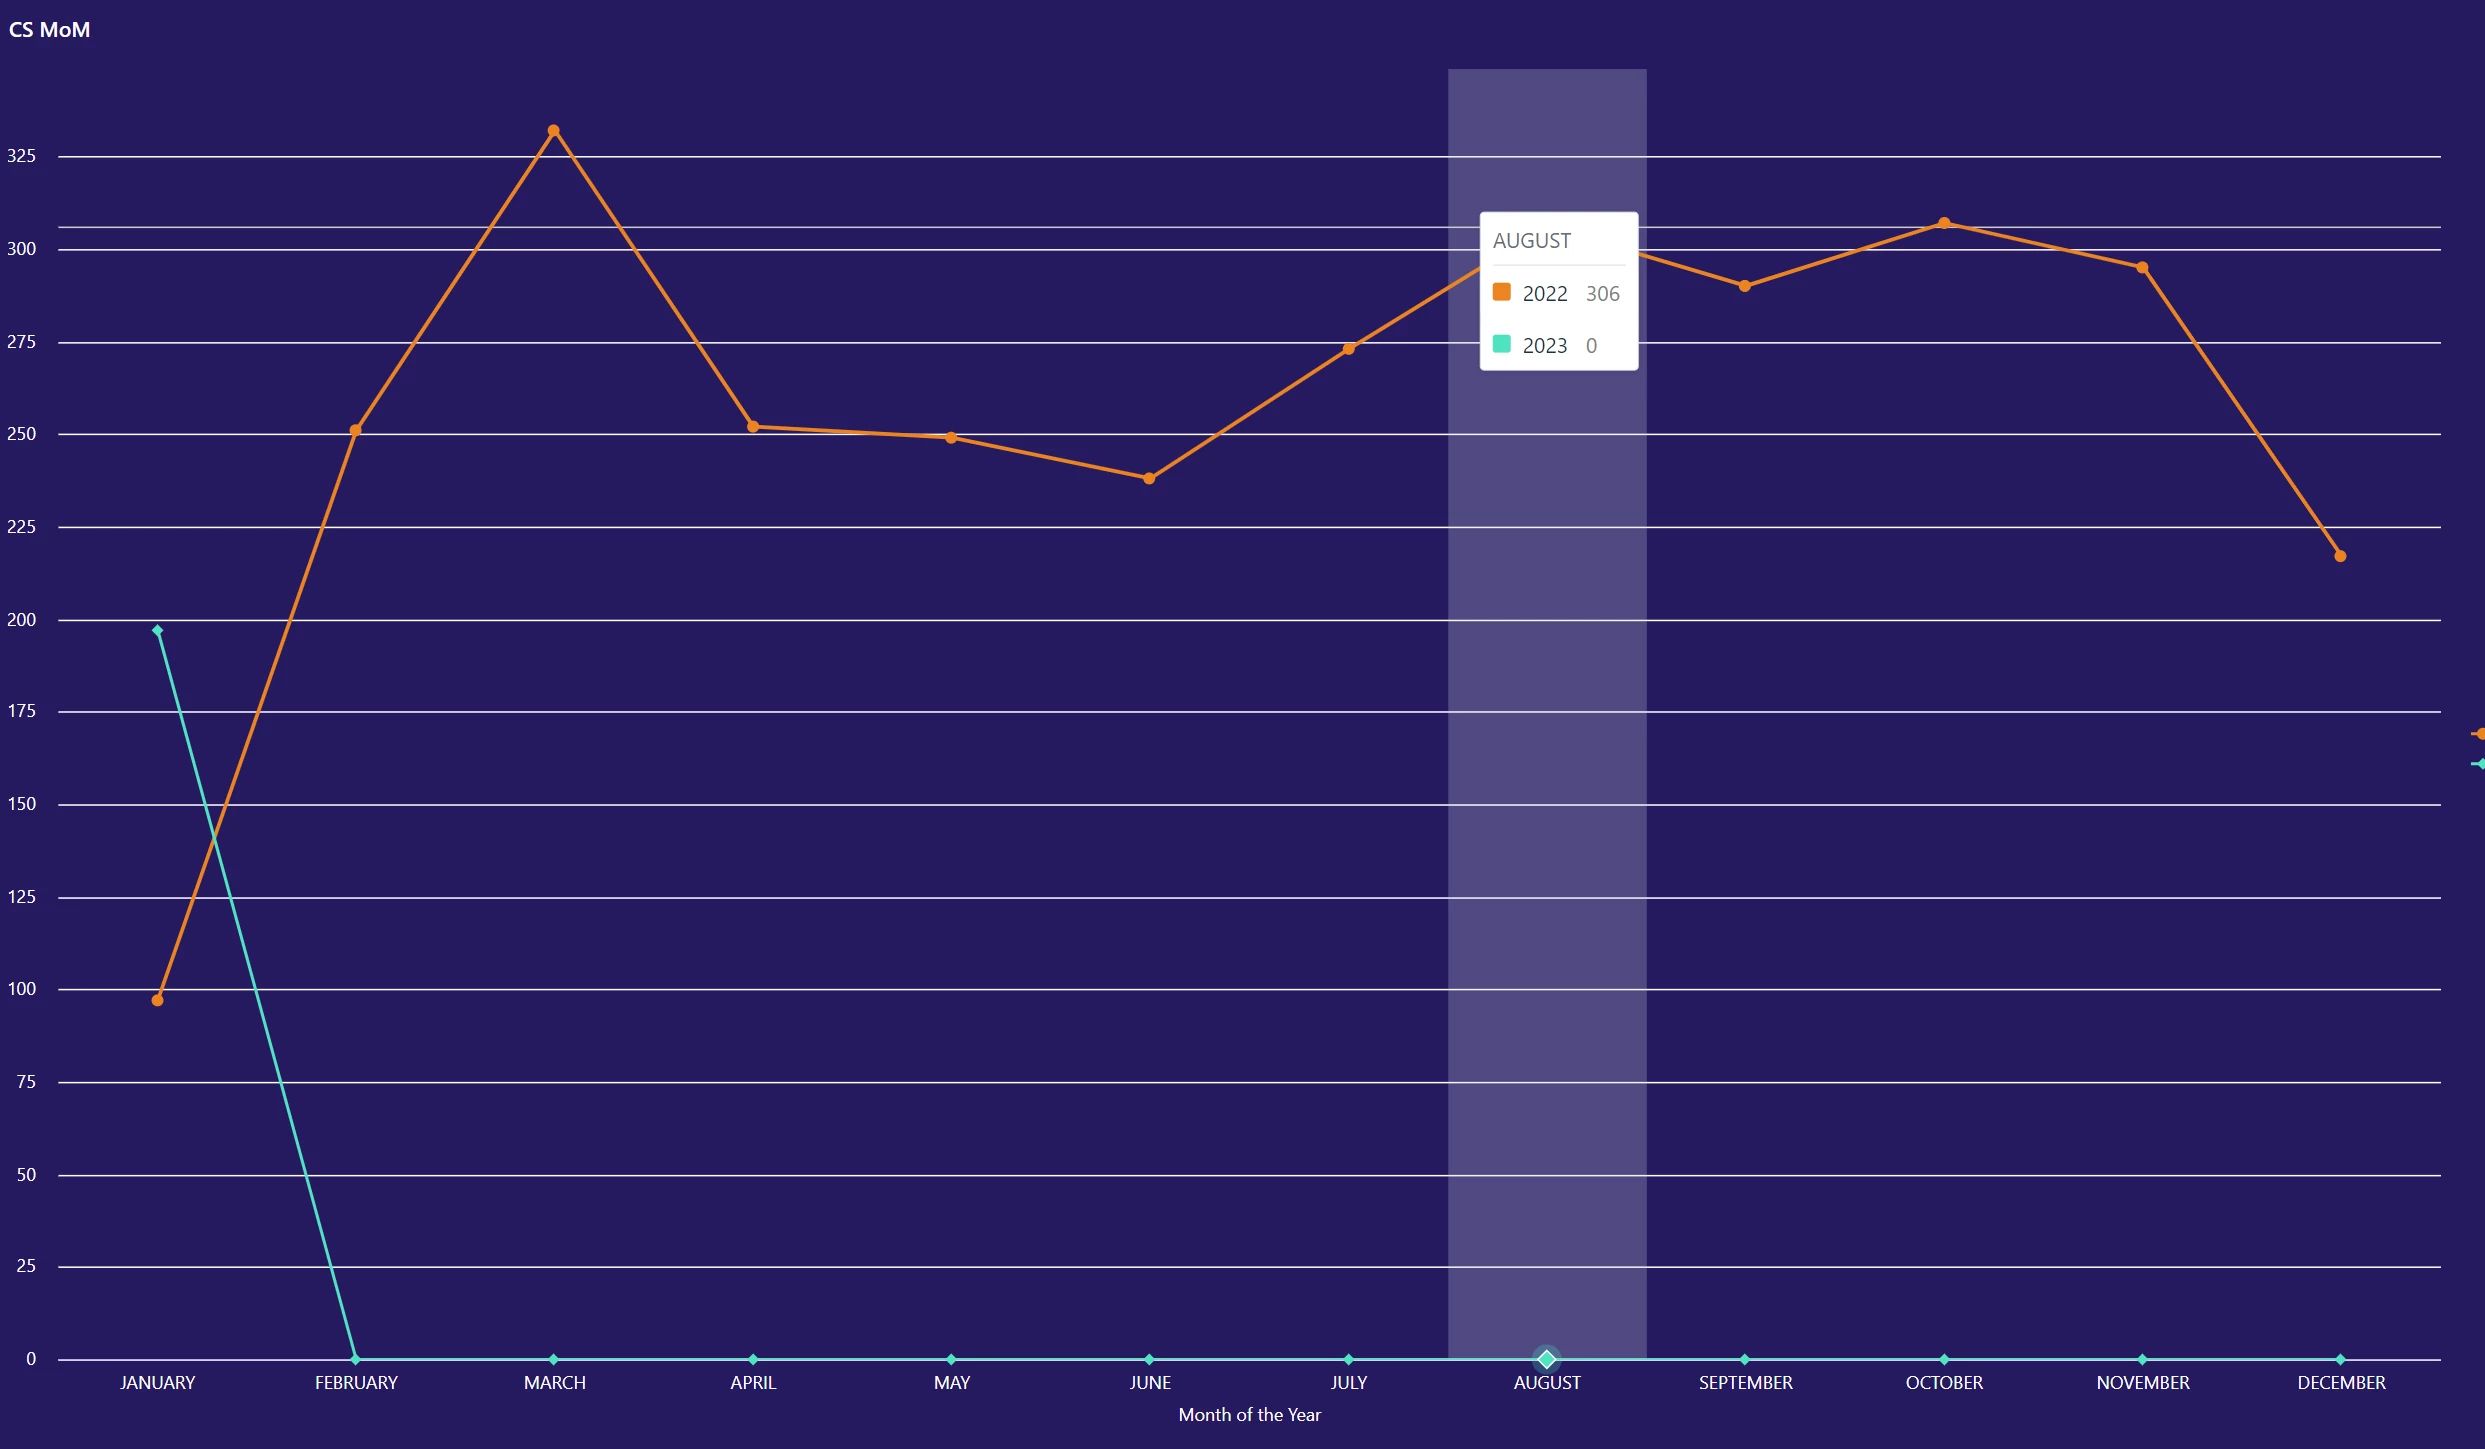
It would be very helpful to be able to have the option to display values on a report e.g. a month on month line graph, permanently rather than on mouseover. This means reports are more easily shared outside of Freshdesk. Example - this report would be easier to read and more meaningful to others if the values were just displayed. 
 

2 replies

Amrit Mishra
Contributor
Forum|alt.badge.img+8
  • Contributor
  • Nov 27, 2024 11:22 AM UTC

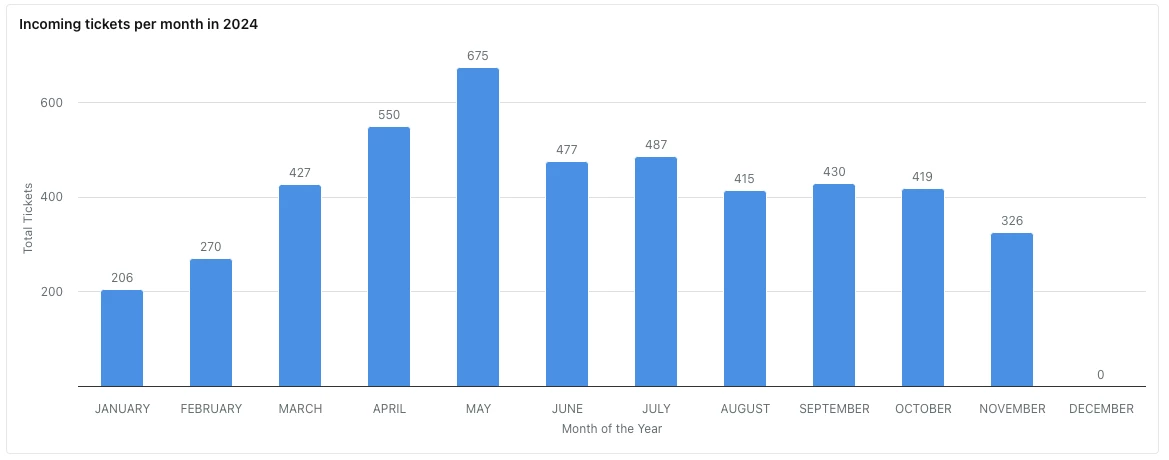
​@e.c.kane This capability currently exists in the Analytics platform. Please see the screenshot below.

However, when you have more than 1 group by, then the data labels don’t appear by default. That idea is being tracked here: 36239.


Amrit Mishra
Contributor
Forum|alt.badge.img+8
  • Contributor
  • Nov 27, 2024 11:24 AM UTC
New Idea→Implemented : Idea is live