
New Idea

Underlyig Data in analytics for time periods filters

Related products:Freshservice
  • February 8, 2024
  • 4 replies
  • 60 views

Forum|alt.badge.img+4


Hello,


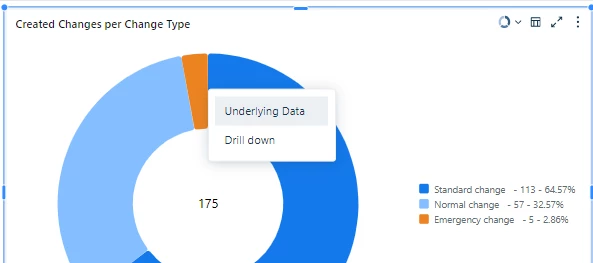
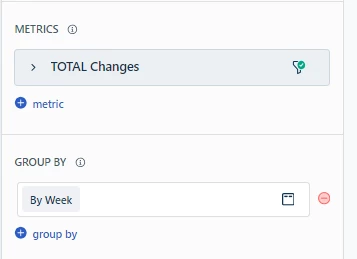
Would it be possible to make the option ‘underlying data’ available for charts grouped by a time periode.


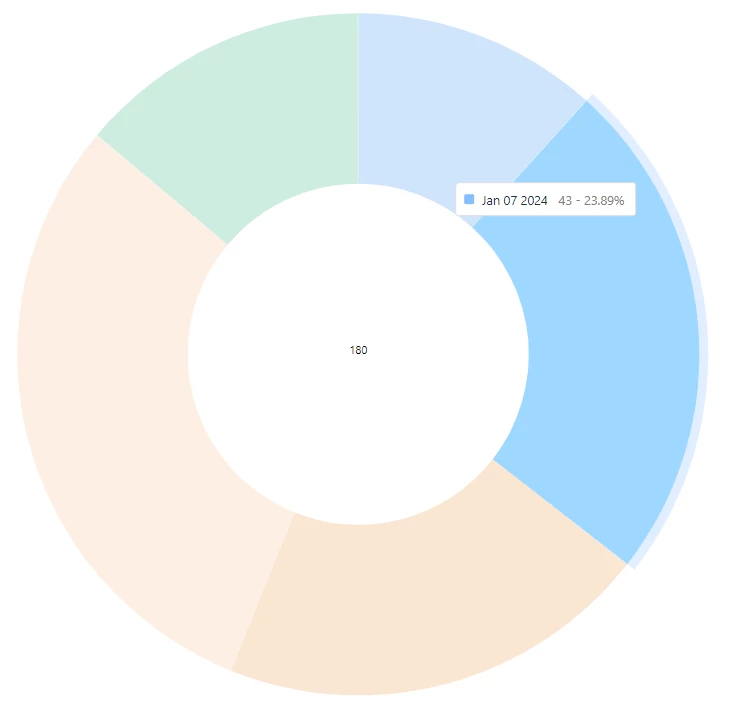
Example option not available:
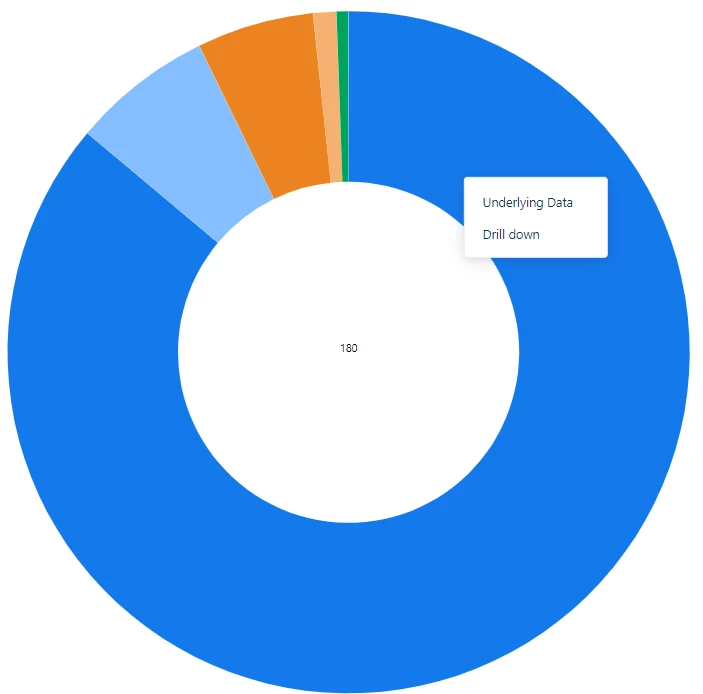
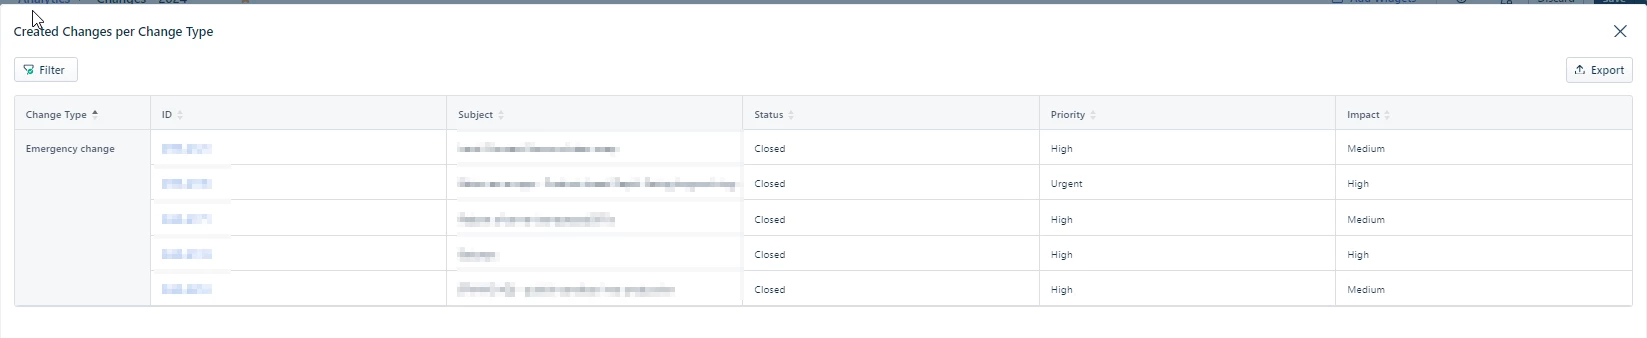
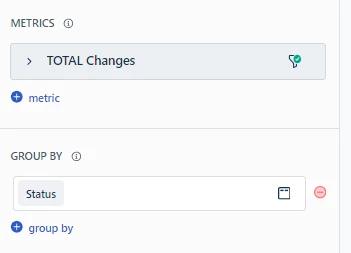
Example 2, option available:


4 replies

Amrit Mishra
Contributor
Forum|alt.badge.img+8
  • Contributor
  • April 19, 2024

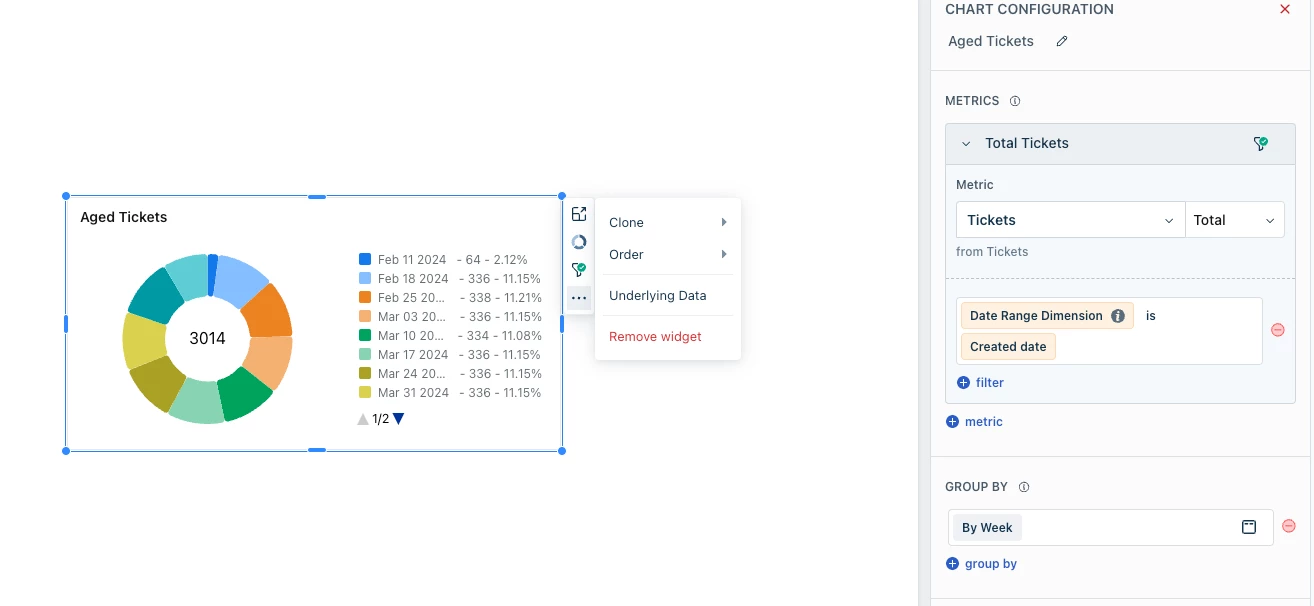
@RobinHen Even though the Underlying Data option isn’t available on clicking on the graph, it appears when you click the dots against the widget. Please see the screenshot below. Does this option appear for your use case?


Forum|alt.badge.img+4
  • Author
  • Skilled Expert
  • April 19, 2024

Hi Amit,

thanks for your response.

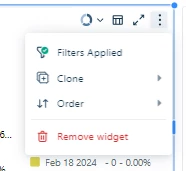
I don’t have the underlying data button but I assume I see it as the table (second) button.


This opens a table with all data of the graph without any filter applied. 

So technically it’s what I need but with other Graphs you can select a part of the pie and it only shows the data of that part.


I keep thinking this is just a bug in the software as it works for all non date related “group by”.


Forum|alt.badge.img+4
  • Author
  • Skilled Expert
  • April 19, 2024

my apologies for misspelling your name @Amrit Mishra 


Amrit Mishra
Contributor
Forum|alt.badge.img+8
  • Contributor
  • April 21, 2024

@RobinHen Now I understand the issue you are highlighting, thanks for explaining. It’s probably designed this way, hence the option to view Underlying Data doesn’t appear for a specific slice of the chart. It will be an enhancement to support underlying data only for a specific selection of the chart when the group by contains a time dimension. We’ll track it internally and share an update when it gets picked up for development.