

Question

CSAT reporting

  • Sep 13, 2023 12:54 PM UTC
  • 1 reply
  • 49 views

e.c.kane
Skilled Expert
Forum|alt.badge.img+3

Hi, 

Wondering if someone can help. 

I’m trying to report MoM CSAT in a graph displaying overall % for the month. 

Example:
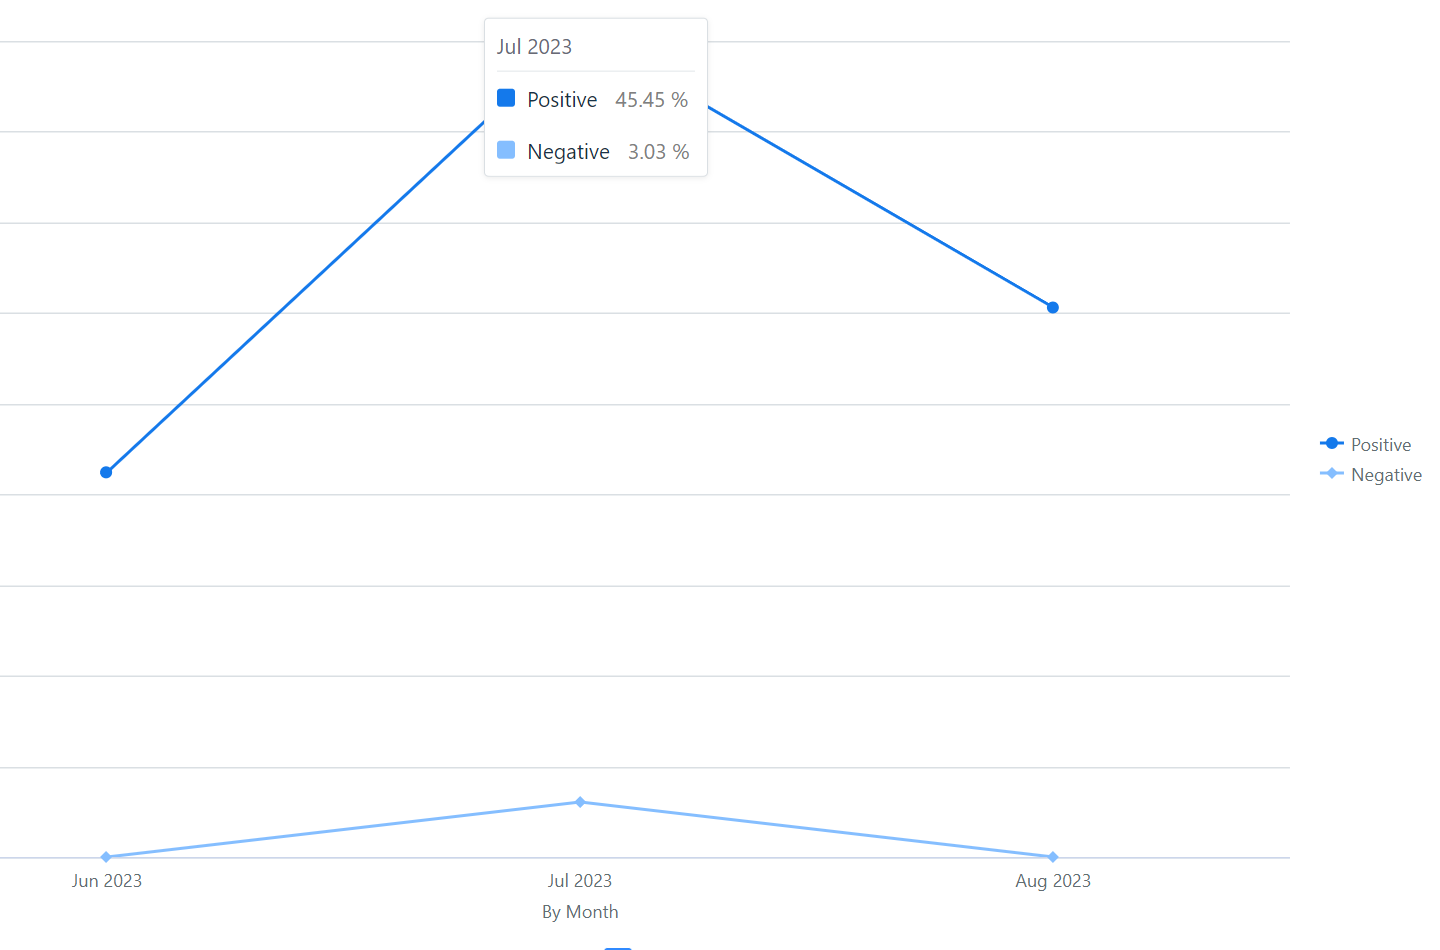


This is wrong, though, as what Freshdesk is doing is diplaying the % of the total for positive over the 90 day/3 month period. 

Is there a way to natively display the data to show the CSAT result for the month in the way e.g. 90% Positive and 10% Negative? 


Thanks, Emma

1 reply

eeha0120
Top Contributor ⭐
Forum|alt.badge.img+12
  • Top Contributor ⭐
  • Nov 3, 2023 5:00 AM UTC

Hi.

Apologies for the late response.

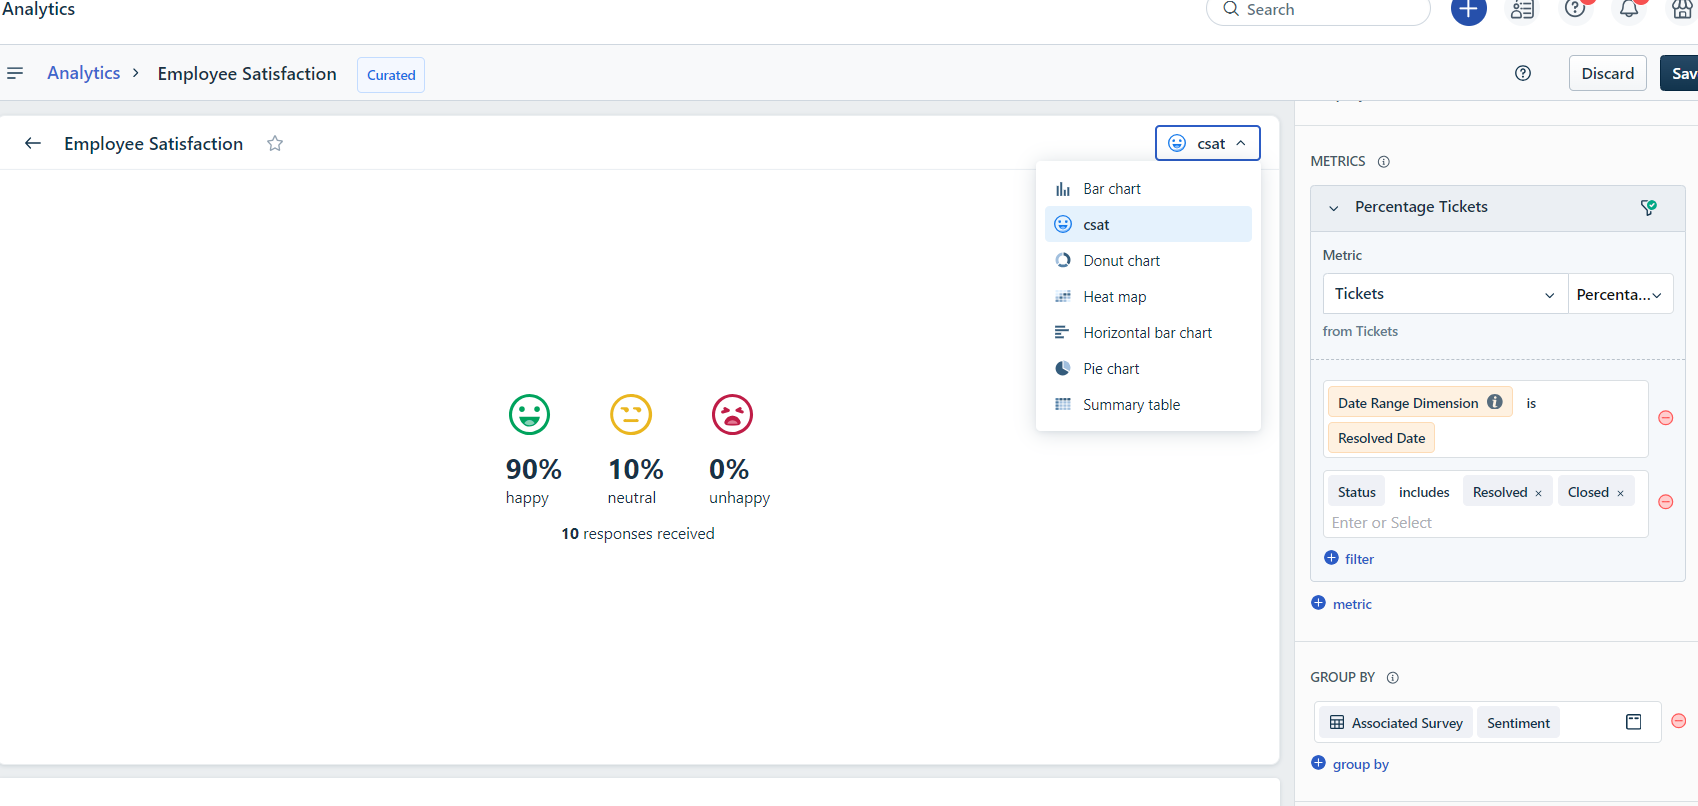
There’s actually a standard / curated report for this:

You may change the display, though not the exact one you have, but you can choose from any of the available options:


Hope this helps.


Regards,