


Solved

Survey Data

  • Mar 5, 2024 9:49 AM UTC
  • 1 reply
  • 90 views

RobCrossAareon
Contributor
Forum|alt.badge.img+1

I’m struggling with Fresh Desk Analytics for Surveys, and I can’t work out where it’s going wrong.

I have a nice simple widget that shows the survey score for the current month


What I want to do now is show the history of my positive and negative scores by month.

When I’m building it, I can choose the number of positive and negative surveys from ticket data, but only the number of positive surveys from the survey data


So, i tried to build it using the ticket data, but because it’s going by ticket data, and not survey data the stats don’t match the first widget that I shared


The group by on my by month widget is set to this


Has anyone been able to get reliable data out of this?
Best answer by Yusuf Ahmed

Hi ​@RobCrossAareon,


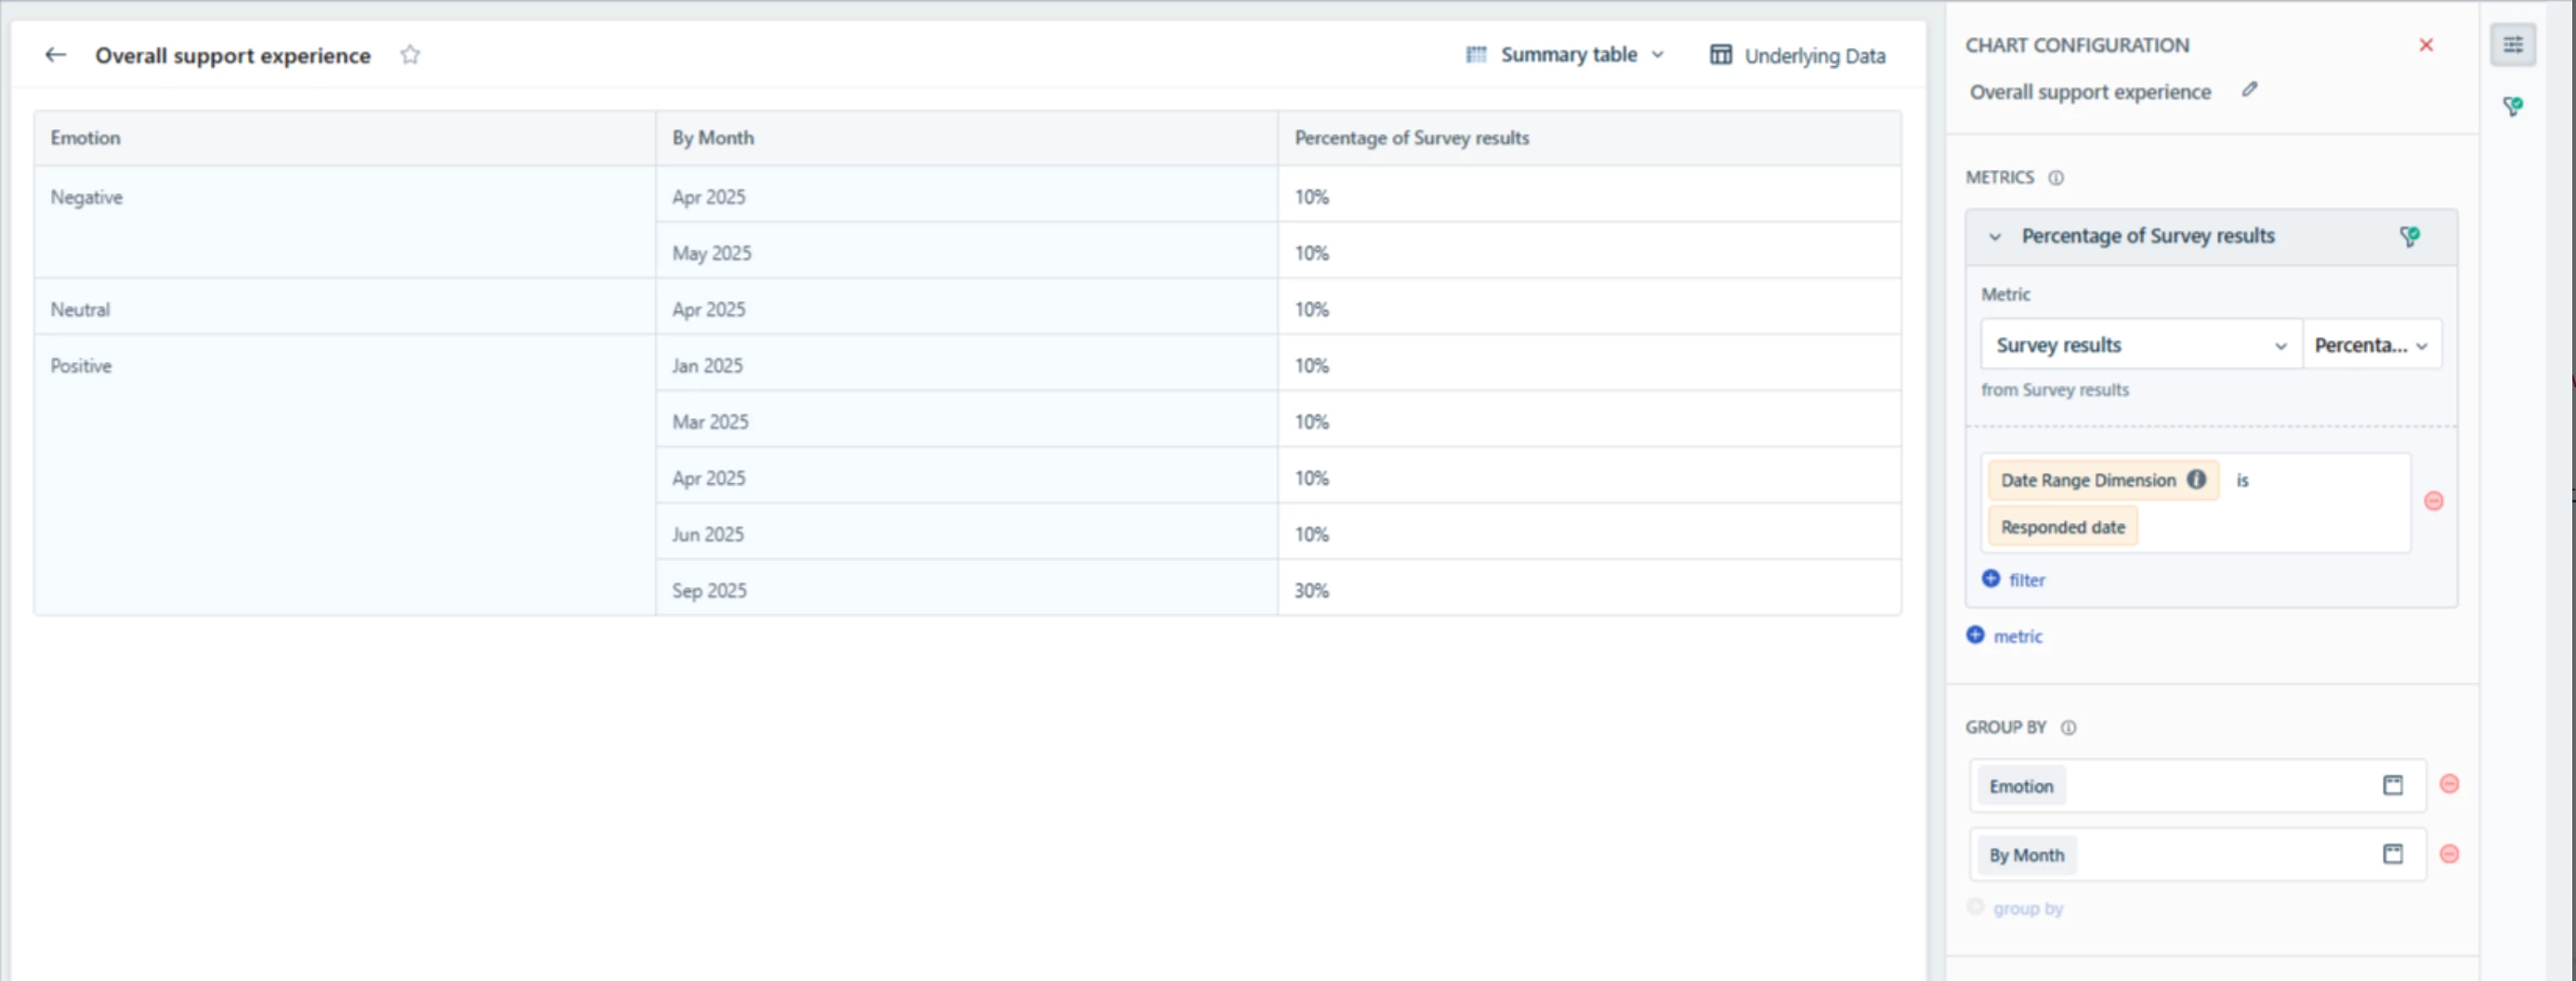
Greetings from Freshworks community.I understand that you are looking to retrieve the split of positive and negative survey responses based on different months. To achieve this, you can use an additional GROUP BY to group the data by month in Analytics.

You can iuse Survey results metric instead of Positive survey metric


I hope this helps. Feel free to reach out to Support@Freshdesk.com if you are looking for a demo assistance, Wishing you a nice day ahead!

View original

1 reply

Yusuf Ahmed
Community Debut
Forum|alt.badge.img+8
  • Community Debut
  • Answer
  • Sep 19, 2025 8:04 PM UTC

Hi ​@RobCrossAareon,


Greetings from Freshworks community.I understand that you are looking to retrieve the split of positive and negative survey responses based on different months. To achieve this, you can use an additional GROUP BY to group the data by month in Analytics.

You can iuse Survey results metric instead of Positive survey metric


I hope this helps. Feel free to reach out to Support@Freshdesk.com if you are looking for a demo assistance, Wishing you a nice day ahead!