Hi,
Wondering if someone can help.
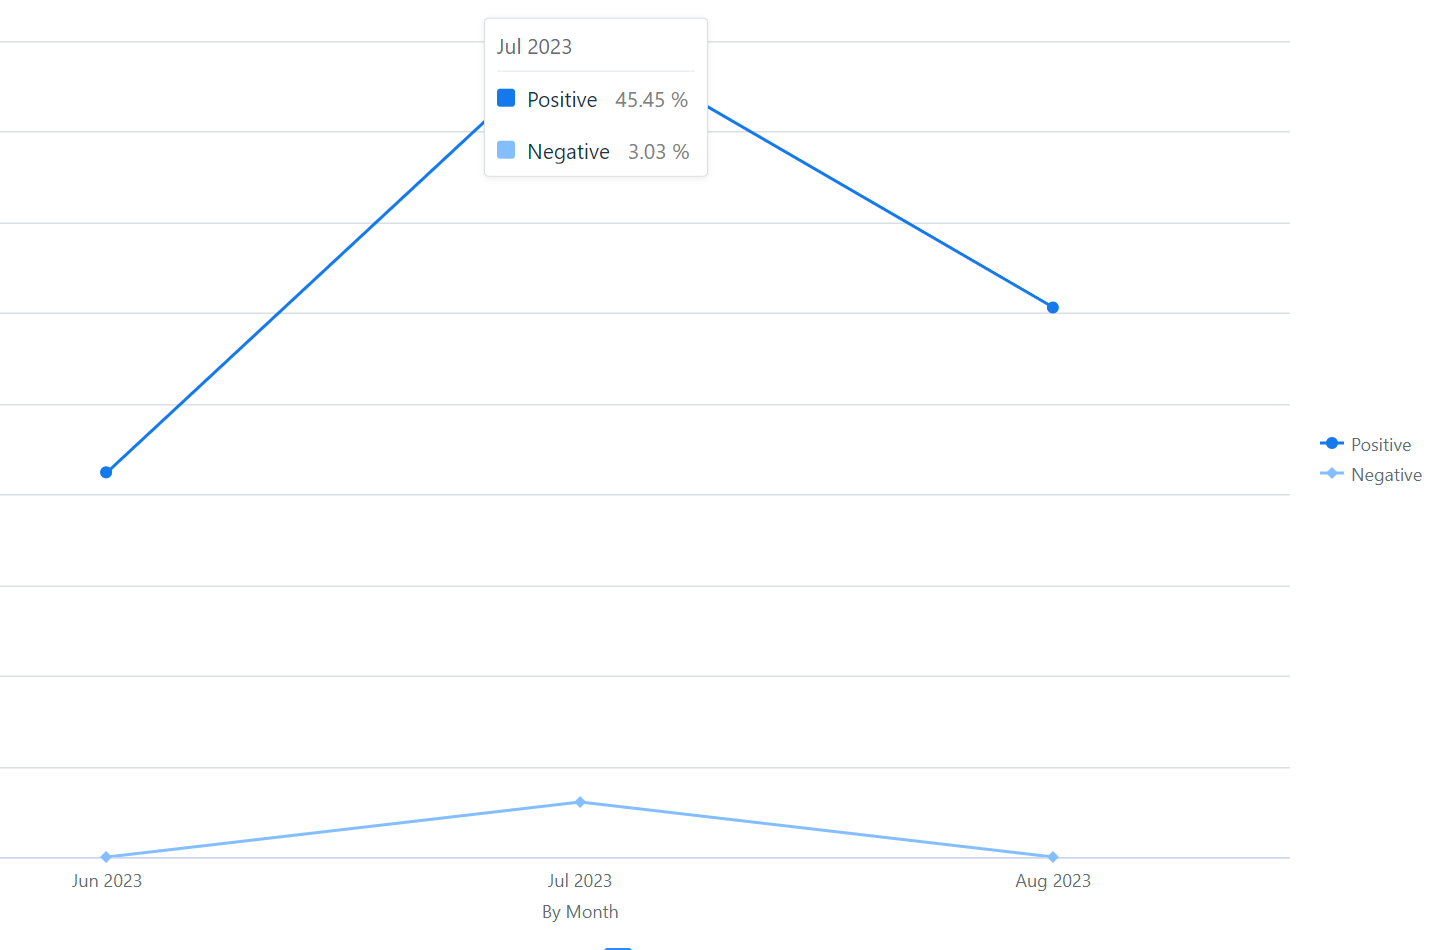
I’m trying to report MoM CSAT in a graph displaying overall % for the month.
Example:

This is wrong, though, as what Freshdesk is doing is diplaying the % of the total for positive over the 90 day/3 month period.
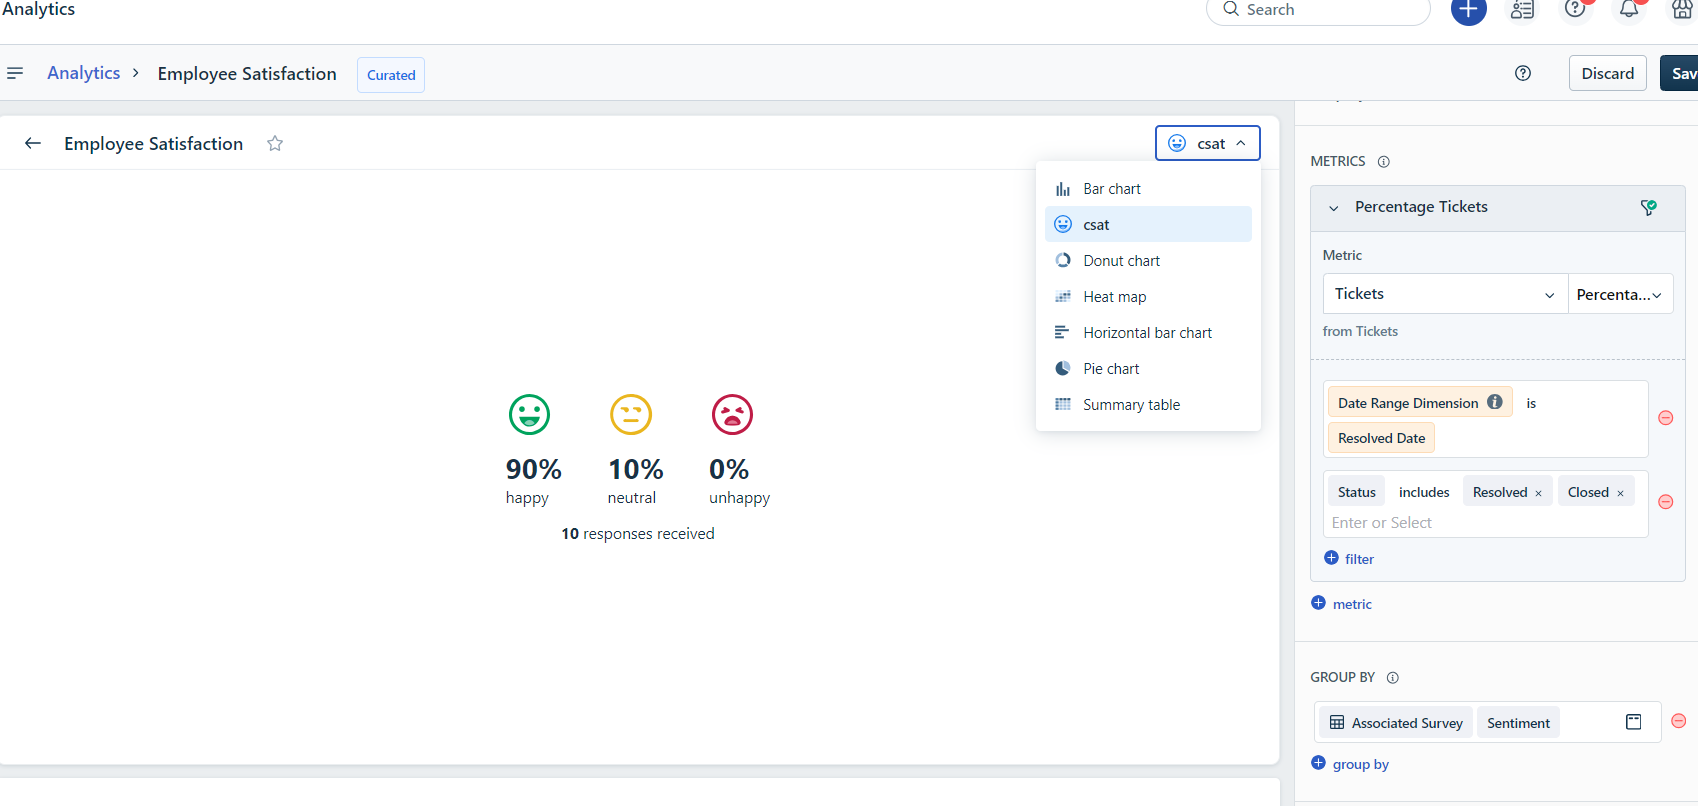
Is there a way to natively display the data to show the CSAT result for the month in the way e.g. 90% Positive and 10% Negative?
Thanks, Emma

