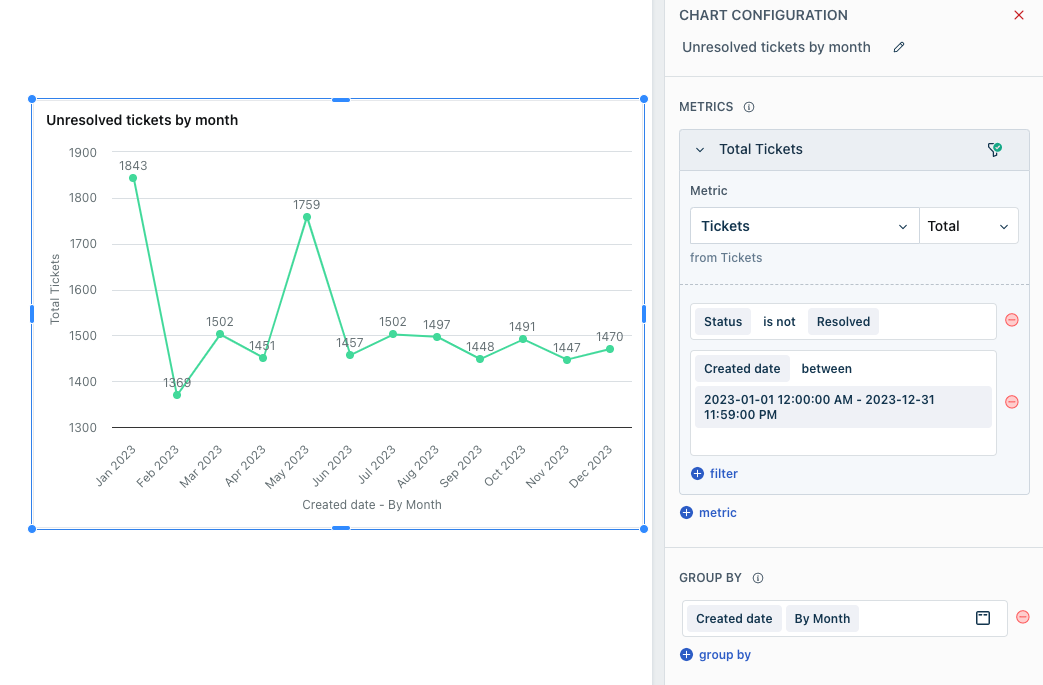
My goal is to track (on a monthly, rolling basis) tickets that were opened within that month that have not yet been closed. For example, if 500 new tickets were opened in March and on March 31st 400 were not in Closed/Resolved status, this metric would be 20%. I don’t need the report to calculate the percentage - I can do that manually if necessary.
I’ve tried a stacked bar chart and was able to get close, but each month’s numbers seem to include previous months’ new tickets if they are still open.
Any help is appreciated.


