
")

Context:
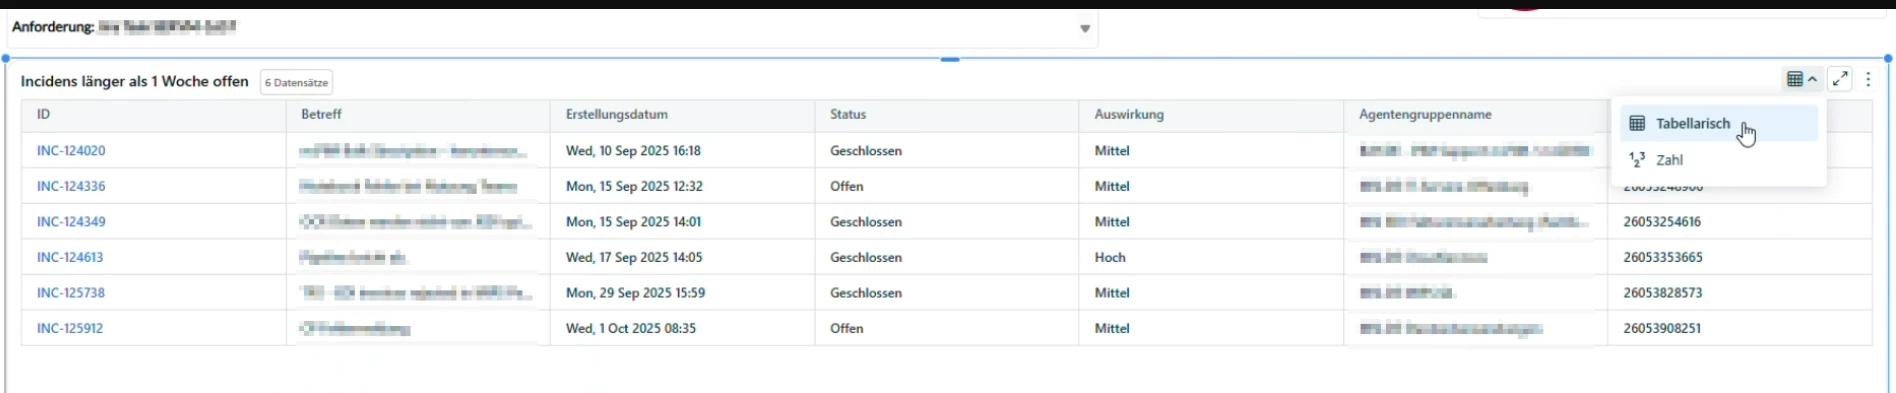
A few years ago, Freshworks offered a visualization feature that allowed users to include tabular ticket data in PDF reports—essentially a summary table showing ticket attributes. This was incredibly useful for generating readable, graphical reports for customers and internal stakeholders.
Unfortunately, this feature was deprecated around mid-2021. Since then, newer accounts no longer have access to this functionality. The current workaround—exporting data as CSV—is not ideal for many users and lacks the clarity and presentation quality of a structured PDF.
Thread in the community: Report view tabular | Freshworks Community
Current Limitations:
- No option to export ticket data in a readable, graphical PDF format.
- The “Underlying Data” feature does not support PDF export, making it an incomplete replacement for the removed tabular view.
- CSV exports are a workaround, but not user-friendly for all regions or use cases.
Why This Matters:
- The removed feature was not redundant—it served a distinct purpose that is not currently met by any other feature.
- Many customers rely on clear, visual reports for audits, compliance, and internal reviews. The lack of a tabular PDF export significantly reduces the usability of Analytics for these purposes.
Request:
Please consider reintroducing the tabular data visualization feature for PDF reports or provide an alternative that allows exporting underlying data in a structured, readable PDF format.