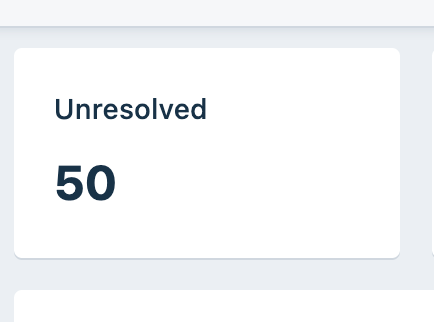
I’m using the analytics and seeing some figures that don’t add up. On our dashboard we have 50 tickets showing as unresolved. That’s backed up by checking the tickets and finding there are 50 with unresolved status.

The Helpdesk ticket volume however shows 58 unresolved tickets. I believe this has something to do with the ‘unresolved tickets by type’ showing 8 tickets with the type blank.
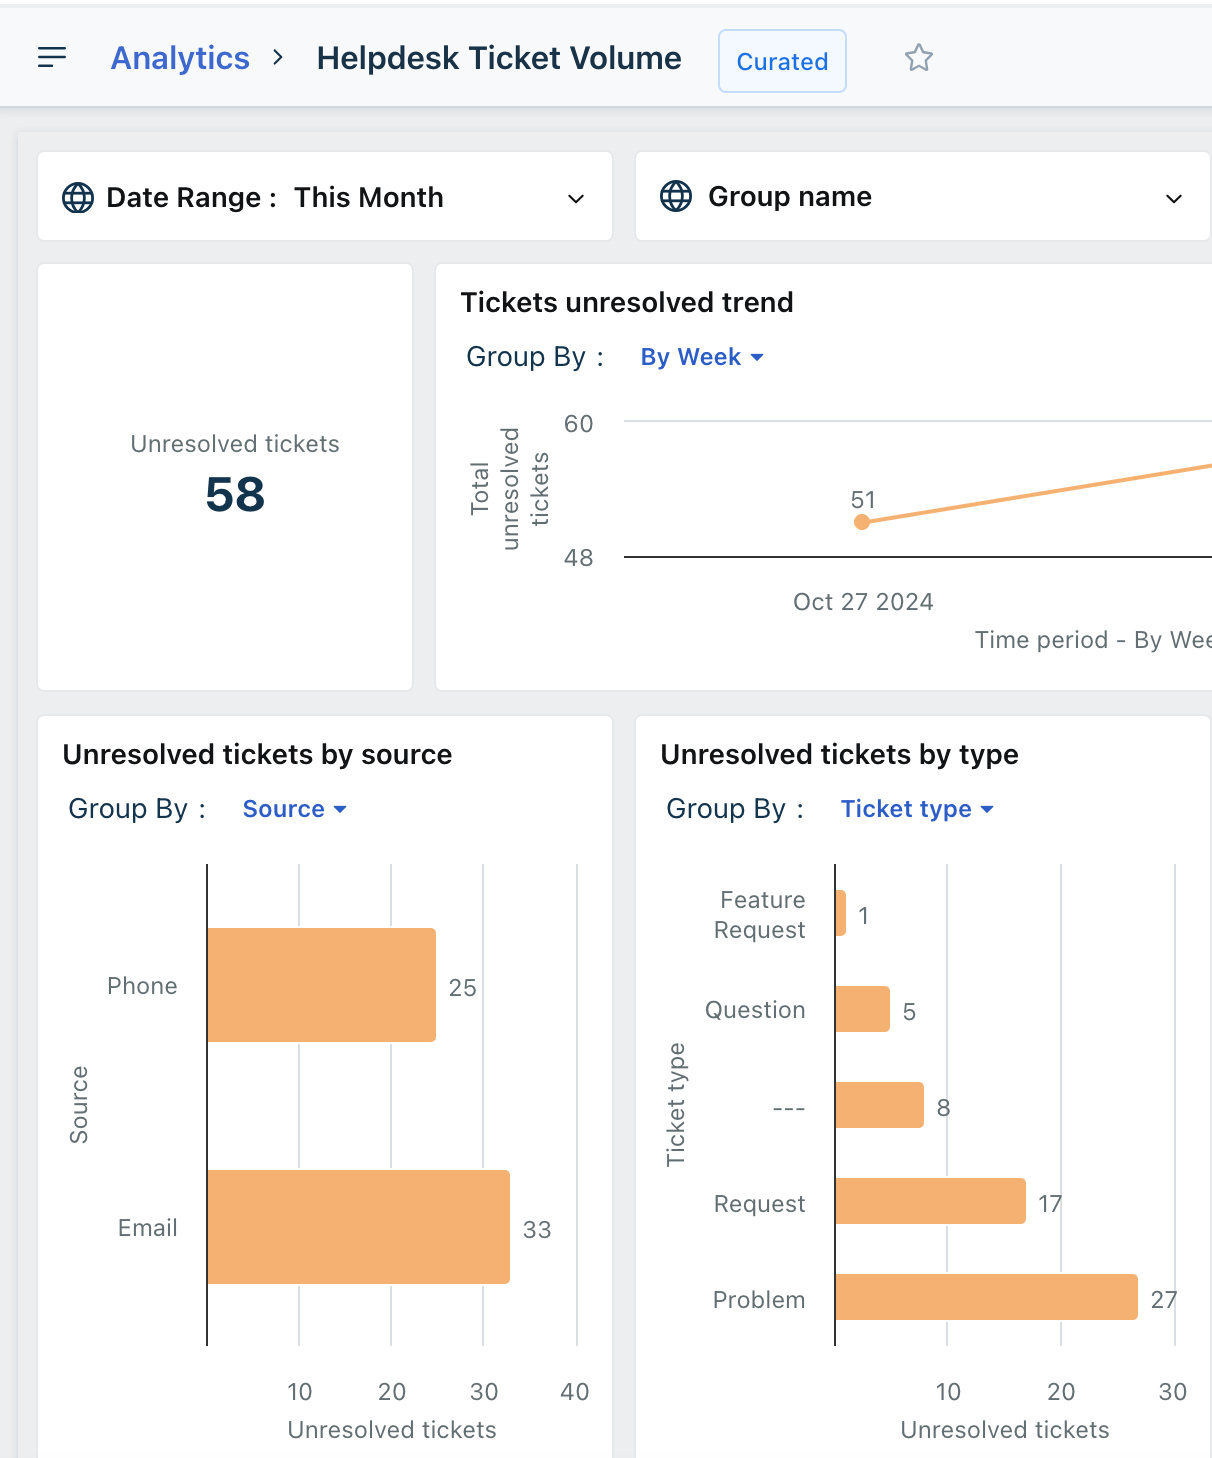

I’ve checked that every unresolved ticket has a type set.

How do I go about finding these 8 rogue tickets?

Analytics is 30 minutes behind  “live” which the dashboard shows. 

Fresh intend to move analytics to “Live” sometime soon, but for now it’s 30 mins behind. 


Thanks, that’s good to know. I”m not sure that’s the issue here though. I looked at this first thing this morning before our support team start work so there would be no recent activity on the system. Of if there was any recent activity it would be new incoming tickets, certainly nothing resolved so if the analytics is behind live then I’d expect it to show less unresolved tickets than the live dashboard rather than showing more.

It’s a shame because the analytics look really useful but it’s making me doubt the figures now.


The my next guess is that you have a date range criteria set on you analytics, and there’s 8 tickets beyond that. It’s likely to be something in your filtering, or your permissions in Fresh, so you may have wider permission in analytics than dashboard?


You should compare an export of the data in analytics and the dashboard view to see which ones are “Rouge”


Reply