Hello,
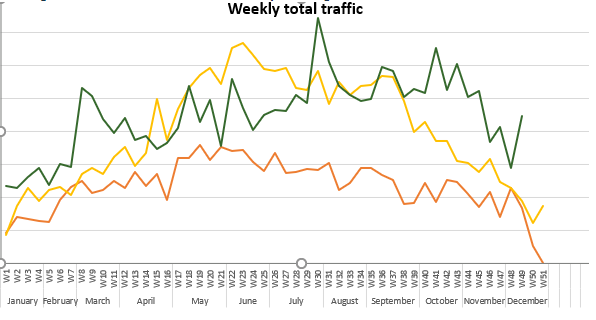
you team has let us know that there is no way to add in analytics a statistic board with comparsion.
For example per month performance compared to last years. In November 2021 we had this many tickets and in November 2020 this many. This all as a bulk diagram or as chart.
Right now analytics does not show it in a good way, Would this be possible?


