Hi everyone,
I try to create a new analytics reports using the interactive widget, BUT with a date range AND each chart need to have this filter too: Created Date on “interactive date range go here” and resolved date on “interactive date range go here”
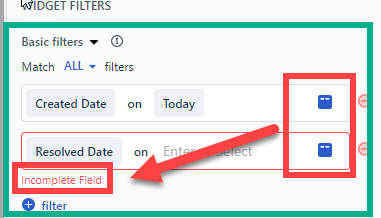
But I try to do this on the chart:

But I still need to enter a specific value which does not update base on the interactive date range widget.
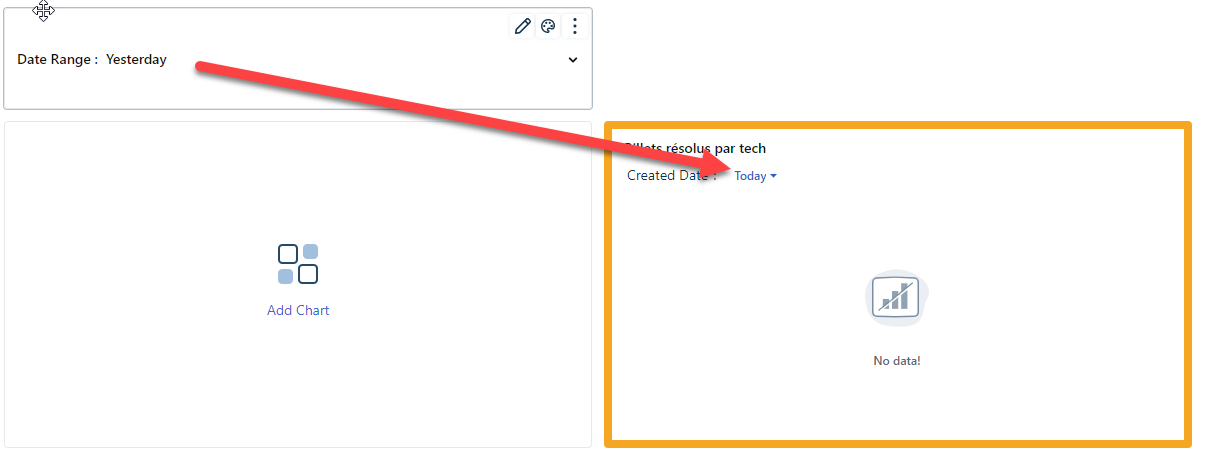
I got this:

I doesn’t want to change each graphic date range if I use the interactive widget.
I probably do something wrong in the analytics report.
Thanks for your help by advanced and have a nice day,

