Hi everyone,


I am trying to create an overview of software that is used per department. I am struggling with it for a while for what I thought it would be an easy overview.

So what I did:

  • I created a widget from scratch using a chart
  • I use the Metric “Users Count (Sum)
  • I group by Name (which is the name of the software)

The only thing I need to add is the department of the user. Whatever I try, it does not give me the correct results.

One difficulty: Some software is linked to ‘Used by’ (the user) and some is linked to ‘Installed’ (the machine). Of course it would be great to see it in one overview, but I can live with two different widgets (one for user, one for machine).


Does anyone have an idea how to solve it?


Thanks, Tom

@TomPeeters Please see if the following steps can help you get the desired report.

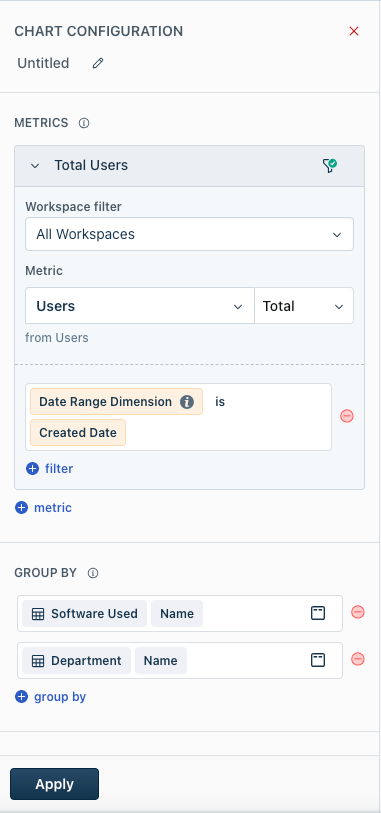
  1. Select metric as ‘Users’ from ‘Users’ module.
  2. Group by ‘Software Used’ ‘Name’ and ‘Department’ ‘Name’.

Screenshot of the configuration attached below.


Hi ​@Amrit Mishra,


It seems this does the trick, thanks a lot!

Is it correct that this displays all software that is logged under Users?
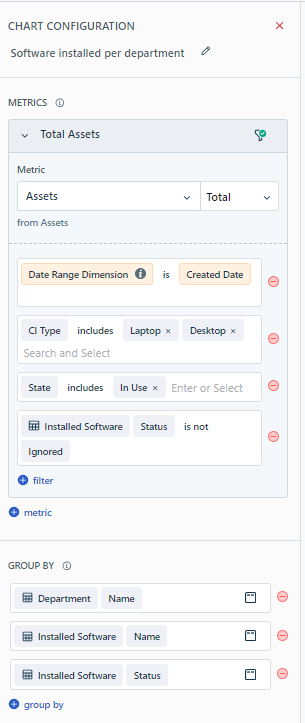
Do you perhaps also know how to create the same overview but for software installations?
In line with your instruction I thought I might use the metric ‘Asset’, but there I have no option to group by Department.


Kind regards,

Tom


Hi ​@Amrit Mishra ,


I was able to create the report on software installations. In line with your instruction I thought I might use the metric ‘Asset’, but there I have no option to group by Department. I had an interactive filter placed on the report. After removing that filter, I had all the group by options i needed.


Thanks for your help!


Tom


Reply