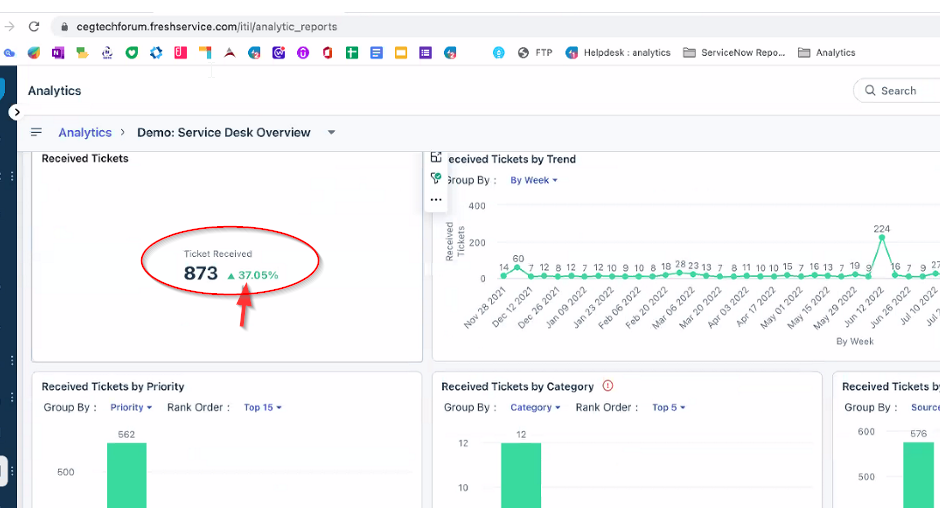
The % comparisons are just the value difference between two refresh times.
The Analytics module refreshes every 30 minutes. This implies that the reports will be refreshed every thirty minutes with the filters and metrics that have been applied to update the findings. If there is a value discrepancy, the % comparison will appear in the widgets.
Furthermore, please note that this only applies to Curated reports, Template widgets, and Clone on Curated reports.
Hey,
I totally get why you'd want that percentage comparison—it’s super helpful for tracking trends over time! Freshservice has some solid reporting tools, but getting that % change calculation can be a bit tricky if you're not familiar with the formulas.
You’ll typically need to pull data for both the current and previous periods, then use a simple percentage change formula:
% Change = ((Current Period - Previous Period) / Previous Period) * 100
If Freshservice’s built-in widgets don’t support this directly, you might need to use a custom metric or an external tool. A calculadora de porcentagem can be really useful for quick checks and making sure your numbers align.
Hope that helps! Let me know if you figure out a seamless way to do it directly in Freshservice—I’d love to hear about it.