
Hey Community,

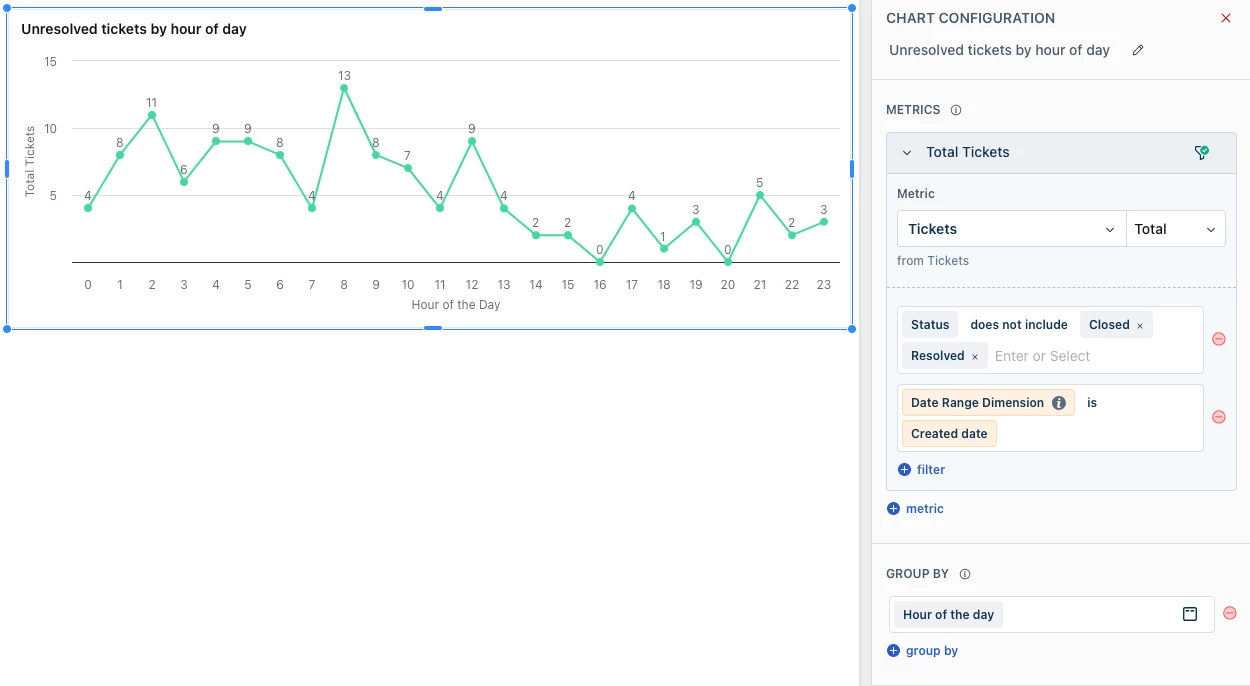
I am try to use analytics in order to build a dashboard that would show me the number of unresolved tickets by the hour of the day (as it would help me to track the workload during the day).

Also, I wish to be able to see this dashboard for each date that I would like to put as a filter on my dashboard (today, yesterday, 2 days ago etc.)

Does anyone has an idea how to make such kind of dashboard?
Thanks!

@amit.e please see if your requirement is similar to the one posted here.


@amit.e please see if your requirement is similar to the one posted here.

@Amrit Mishra Thanks but that one is not suitable.
I wish to see the amount of unresolved tickets on each hour of day in order to have a bit more knowledge on what is the current workload at every point of time during each day


@amit.e Please see if a similar chart as the following would be useful to you. Since the OOTB metric ‘unresolved tickets’ doesn’t support grouping by hour, you can use the ‘tickets’ metric, add suitable filters to exclude the relevant statuses that you don’t need (for example, ‘closed’, ‘resolved’, etc.), and then group by ‘Hour of the day’.


Reply