I’m Navin, a technical writer here at Freshworks. I’d love for you to join our upcoming Analytics Coffee Chat on September 17th—19th.This chat is focused on helping you make the most of the Analytics module in CX (Freshdesk, Freshchat, Omnichannel, and Customer Service Suite). It is an opportunity to discuss and learn more about using analytics to improve your customer experience strategy.
We’d love to hear from you, so please drop your queries, and our experts will respond within the days mentioned above. Topics include navigating the Analytics interface, creating curated and custom reports, using widgets and filters, adding custom metrics and attributes, and exporting and scheduling reports.
If you're new to analytics or looking to dive deeper, please get the answers you need at your convenience.
Here are some questions to trigger your thoughts:
How can we analyze ticket response and resolution times to pinpoint and resolve bottlenecks in our support workflow?
What approaches can help us evaluate individual and team performance metrics to enhance agent effectiveness and uncover training needs?
Which strategies are effective for forecasting ticket volume trends, enabling us to optimize staffing levels and maintain adequate coverage during peak periods?
How can we leverage ticket data analysis to identify recurring issues and address these common problems, thereby improving overall service quality?
Note: This is a text-based conversation. To participate, please leave your questions in the thread below. Our experts will be responding live from September 17 to 19, 2024.
Please keep the following in mind while adding your queries:
This is purely a text-based conversation. Our experts can provide detailed steps for configuration and supporting materials but will not configure the feature over a call.
If you’re unsure how to use a feature, why a specific configuration isn’t working the way it should, or about a business use case, you’ve come to the right place!
This coffee chat session is specifically for questions about the analytics module in Freshdesk, Freshchat, Omnichannel, and the Customer Service Suite.
If you’ve already raised a support ticket, our support team will reply with your query.
We look forward to speaking with you and hearing from you!
Best,
Navin
Page 1 / 2
I think your example questions are all great starting points.
My biggest confusion is Dashboards vs Analytics Dashboards are great, and I love the click through/drill down functions, but Analytics are much more powerful - would be great if you could combine the two
Hey @Navin Denzil - looking forward to learning more through this coffee-chat session! One of the regular questions we’ve seen have been:
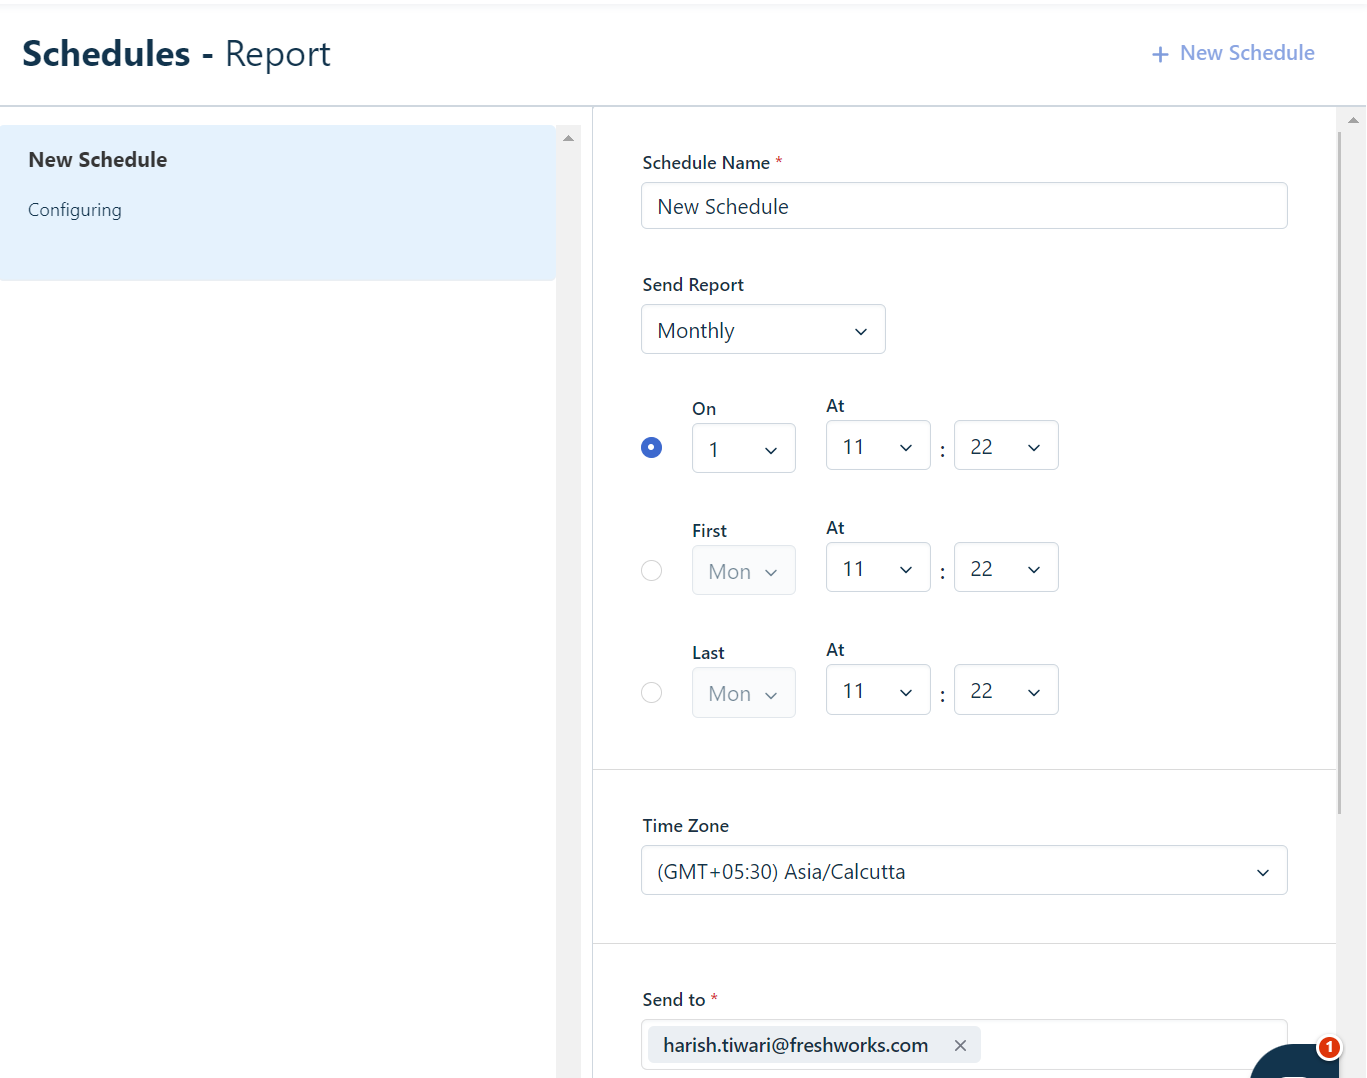
How can customers schedule a report on the 1st of each month that automatically reflects the data for the previous month without needing to reschedule it each time?
Can a report be scheduled for the leadership team and other team members on different days?
I’d love to hear more on your thoughts about the above and also see more on the conversations with our customers!
@alyssia.correa
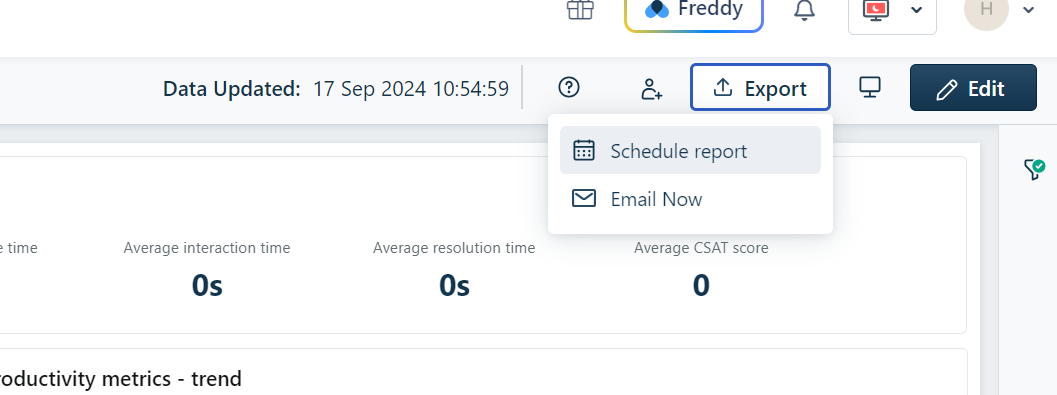
Customer can go to custom report they have created and look for schedule button
Once you click on this , the next screen will allow you to setup monthly exports and you can configure multiple schedules for the same report targeeted for different audiences.
Note :
You cannot schedule exports on curated reports, so you may have to clone them to see the schedule option
@RobCrossHM We do plan on combining the two and we have this on our roadmap , you will start seeing some progress along these lines from H1 2025 onwards.
@RobCrossHM - Absolutely! We’re developing a feature that will allow us to add any analytics charts to our dashboard.
I think your example questions are all great starting points.
My biggest confusion is Dashboards vs Analytics Dashboards are great, and I love the click through/drill down functions, but Analytics are much more powerful - would be great if you could combine the two
@RobCrossHM Absolutely! We’re developing a feature that will allow us to add any analytics charts to our dashboard.
Hello everyone! Great to see that our CX Analytics Coffee chat has begun - I’m tagging some of our members should you or any of your other peers have any queries to ask product panel : @julia.a@shannon.mejia@Crocus_Benford@AaronParker@Daniel Söderlund@eeha0120@zachary.king@marion.lubat
Do you have any plans to improve the filters on analytics?
if I have a survey widget and a ticket widget on the same page, I can’t apply many of the useful filters (like customer name, or ticket group) to the page
Hi folks! What’s brewing ?! :) Have a question I’d like help with. Is it possible to track both the Number of Open Tickets and the Average Response Time in a single widget?
I think your example questions are all great starting points.
My biggest confusion is Dashboards vs Analytics Dashboards are great, and I love the click through/drill down functions, but Analytics are much more powerful - would be great if you could combine the two
@RobCrossHM Absolutely! We’re developing a feature that will allow us to add any analytics charts to our dashboard.
I suppose a bigger question is why have Dashboards as well as analytics - why note have one module that can do both
Any plans to add a trendline to charts?
Any plans to add a trendline to charts?
Yes, @RobCrossHM - We're developing a feature that will let users add and configure benchmark or trend lines on charts. You can expect the launch in Q1,2025.
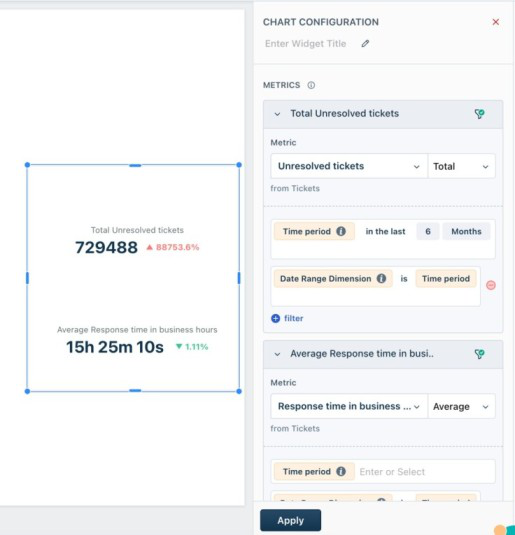
Hi folks! What’s brewing ?! :) Have a question I’d like help with. Is it possible to track both the Number of Open Tickets and the Average Response Time in a single widget?
Absolutely. This can be done using the following configurations. Please refer to the screenshot for details.
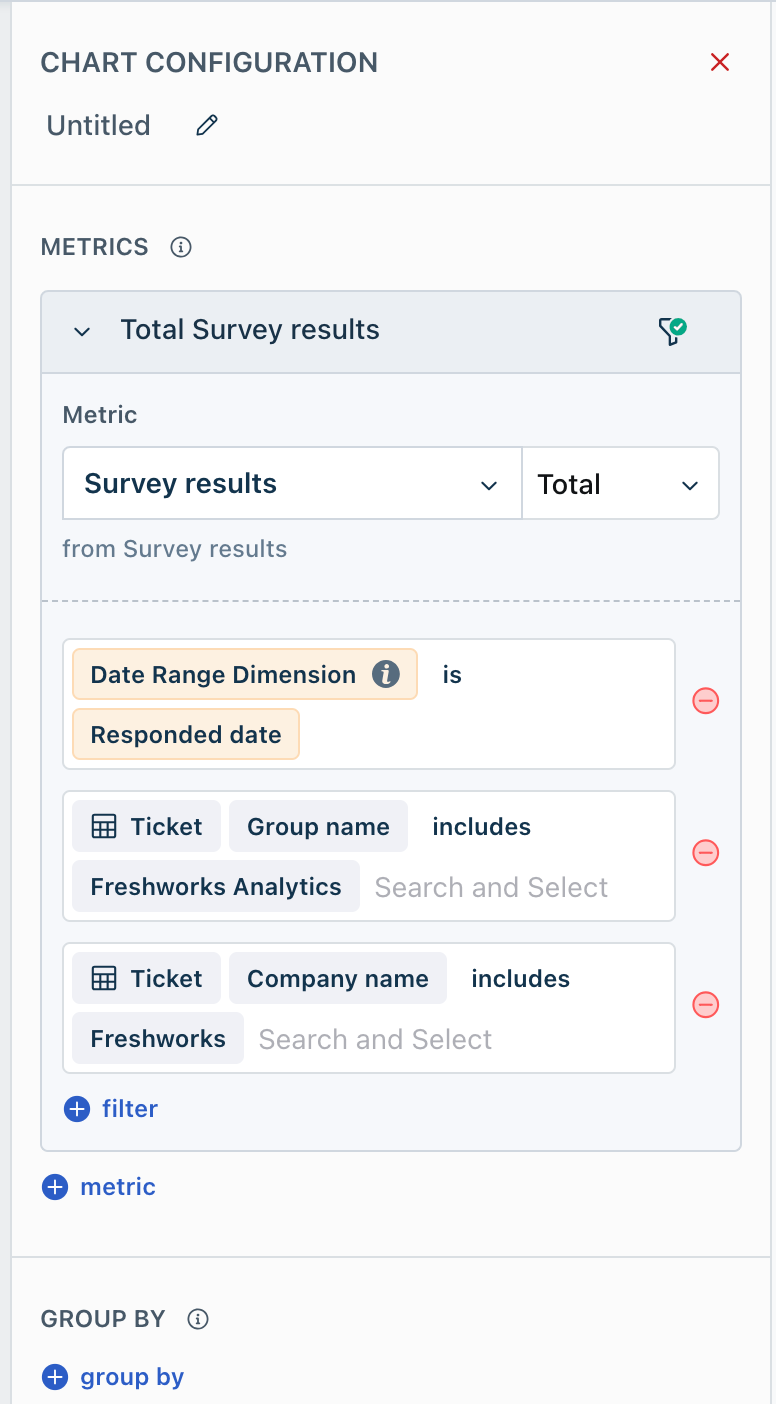
Do you have any plans to improve the filters on analytics?
if I have a survey widget and a ticket widget on the same page, I can’t apply many of the useful filters (like customer name, or ticket group) to the page
@RobCrossHM - At the moment, we can’t filter using all fields from the Company module. However, filtering by Company name and Group name is still possible from the Ticket module. Please see the attached image for the configuration details.
Additionally, we’re launching a project to introduce "Company" and "Contacts" as separate modules associated with the Survey widget, which should address this use case comprehensively. You can expect the launch in the first half of 2025.
@Ramkishore Gopalan I have a very different experience to this - if I have a report which has both surveys and ticket widgets, I can’t add any page or report filers, I have to put the filter on each individual widget
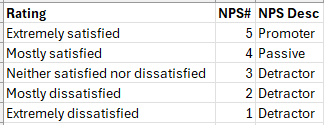
We’ve agreed a way to generate our NPS score using the 5 point scale on our Surveys.
Is there anyway to incorporate this into Analytics to generate my NPS score? Currently, I’m throwing the data into excel, but would be good to get this done natively.
Hi, in all transparency, the company in which I work is rather dissatisfied with Analytics unfortunately because there are only two levels of “group by”. So we have to extract the data to exploit it internally. Do you have any plans to increase this two-level ceiling to enable your customers to build more advanced analyses?
Thank you.
Hi again,
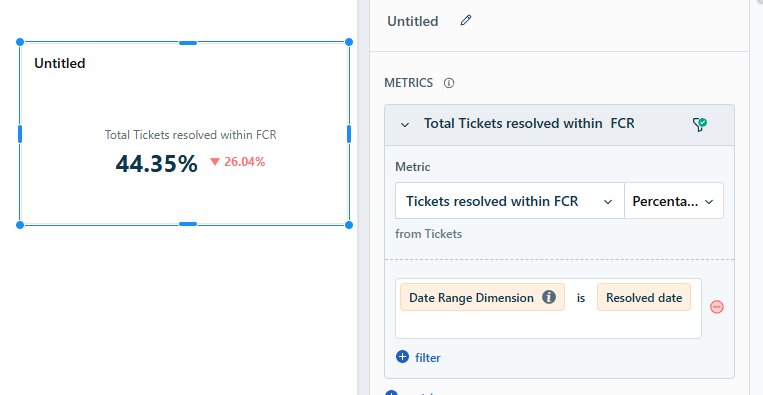
Is there a way to find out how many tickets have been resolved in a single contact, without reopening them afterward? This is what we consider to be true “First Contact Resolution”, meaning that in a single response, we have resolved the ticket, without the customer ever reopening it.
Thank you for your help!
In the “Style” section, we can only customize by widget.
However, I sometimes need to build entire pages with the same information, but on different dates or markets, for example.
Is there a way to make the “number of tickets resolved” data style, for example, always the same color on a page? I don't think so, but it could make it easier to build and present analytics that are easier to understand.
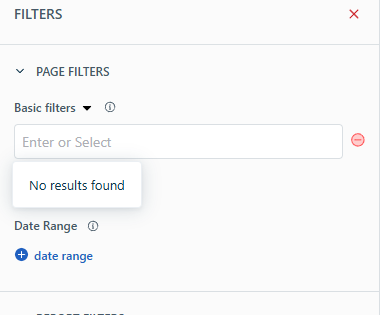
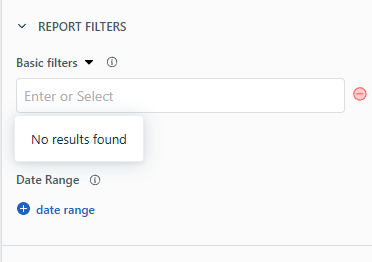
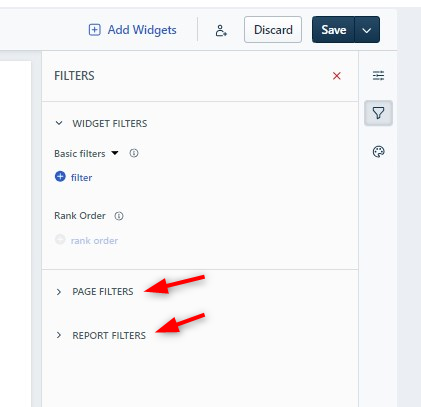
Regarding filters, I think it's great to be able to filter by widget, page or complete report. However, sometimes managers can't find the information they're looking for, because too many filters have been applied. For example, when we go to the “Filters” menu, only the widget is unfolded and the others are folded.
Wouldn't it be possible to add a small colored bullet, for example, to indicate that a filter exists on the Report or on the page?
There may be another way of doing this, but the idea would be to make the information more easily detectable.
Hi again,
Is there a way to find out how many tickets have been resolved in a single contact, without reopening them afterward? This is what we consider to be true “First Contact Resolution”, meaning that in a single response, we have resolved the ticket, without the customer ever reopening it.
Hi, in all transparency, the company in which I work is rather dissatisfied with Analytics unfortunately because there are only two levels of “group by”. So we have to extract the data to exploit it internally. Do you have any plans to increase this two-level ceiling to enable your customers to build more advanced analyses?
Thank you.
Hi SophiaEM,
This is possible even today using Custom attributes feature. We can concatenate all the required string values (attributes) for the group by and use the custom attribute in the chart’s group by field. Hope this helps.
For example: Concat(Source, Priority, Agent Name, Group Name)
Do you have any plans to improve the filters on analytics?
if I have a survey widget and a ticket widget on the same page, I can’t apply many of the useful filters (like customer name, or ticket group) to the page
@RobCrossHM - At the moment, we can’t filter using all fields from the Company module. However, filtering by Company name and Group name is still possible from the Ticket module. Please see the attached image for the configuration details.
Additionally, we’re launching a project to introduce "Company" and "Contacts" as separate modules associated with the Survey widget, which should address this use case comprehensively. You can expect the launch in the first half of 2025.
@Ramkishore Gopalan I have a very different experience to this - if I have a report which has both surveys and ticket widgets, I can’t add any page or report filers, I have to put the filter on each individual widget
Hi @RobCrossHM - We want to understand more about the configurations made.Could you please raise a ticket with us? We’d be happy to take it up and work towards a resolution for you.
Regarding filters, I think it's great to be able to filter by widget, page or complete report. However, sometimes managers can't find the information they're looking for, because too many filters have been applied. For example, when we go to the “Filters” menu, only the widget is unfolded and the others are folded.
Wouldn't it be possible to add a small colored bullet, for example, to indicate that a filter exists on the Report or on the page?
There may be another way of doing this, but the idea would be to make the information more easily detectable.
Thank you for your feedback, @SophiaEM . We will certainly take this into account during our future UI revamp initiatives
In the “Style” section, we can only customize by widget.
However, I sometimes need to build entire pages with the same information, but on different dates or markets, for example.
Is there a way to make the “number of tickets resolved” data style, for example, always the same color on a page? I don't think so, but it could make it easier to build and present analytics that are easier to understand.
@SophiaEM This is a valuable request. While we don't have this feature in our near-term roadmap, we will definitely consider it for our long-term planning.